Lecture 03 - More color
Color wheel example
Last time we were trying to sort out how the color wheel might be drawn I left you on a cliffhanger – how do we compute the points of the triangles?
Time to remember our trig
sine: opposite / hypotenuse
cosine: adjacent / hypotenuse
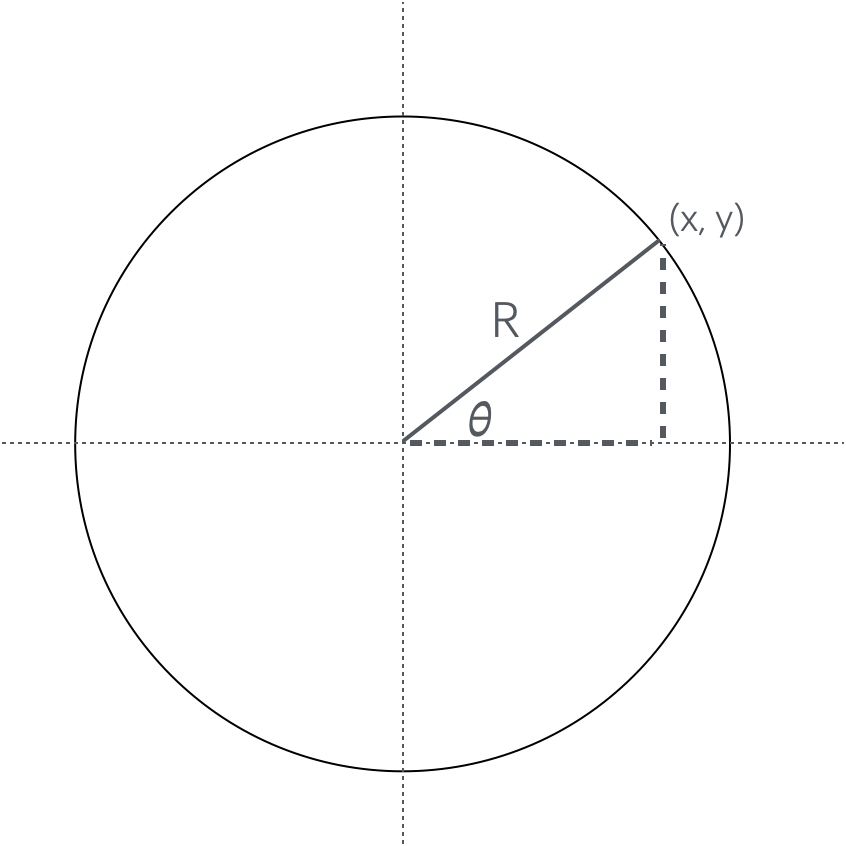
Finding points on a circle
This gives us our equations for points on the circle \((x + R \cos(\theta), y + R\sin(\theta))\)
Once we know how to find a point on the circle at a certain angle, this becomes easier
However, we are going to look at a new tool for drawing shapes You will notice that the triangle is a little tedious to write
We have another form
beginShape
beginShape(MODE);
vertex()
...
endShape();
This allows us to create arbitrary shapes
Modes are
- undefined – gives us arbitrary polygon
POINTSLINESTRIANGLESTRINAGLE_STRIPTRIANGLE_FANQUADSQUAD_STRIP
Code
const NUM_SLICES = 50;

function setup() {
  createCanvas(800, 800);
  noStroke();
  colorMode(HSB, TWO_PI, 100, 100);
}

function draw() {
  background("white");
  const slices = NUM_SLICES;
  const angle = TWO_PI / slices;
  const radius = 300;
  const cx = 400;
  const cy = 400;

  beginShape(TRIANGLE_FAN);
  vertex(cx, cy);
  for (let i = 0; i <= slices; i++) {
    fill(angle * i, 100, 100);
    vertex(cx + radius * cos(i * angle), cy + radius * sin(i * angle));
  }
  endShape();
}
Note that there are two ways that we can count the slices. The above loop iterates the number of slices. An alternative is this:
const NUM_SLICES = 50;

function setup() {
  createCanvas(600, 600);
  noLoop();
  noStroke();
  colorMode(HSB, TWO_PI, 100, 100);
}

function draw() {
  background("white");

  const slices = NUM_SLICES;
  const radius = width * 0.475;
  const cx = width / 2;
  const cy = height / 2;
  const offset = TWO_PI / slices;

  beginShape(TRIANGLE_FAN);
  vertex(cx, cy);
  for (let angle = 0; angle < TWO_PI + 0.1; angle += offset) {
    fill(angle, 100, 100);
    vertex(cx + radius * cos(angle), cy + radius * sin(angle));
  }
  endShape();
}
The second version is conceptually a little cleaner, perhaps, but it has an issue with the end condition since we are comparing to a float. So I had to add an epsilon in there.
adding a slider
We can add a slider to determine the number of divisions
declare the variable at the top
initialize it in setup()
divisionSlider = createSlider(3, 80, 50, 1);
divisionSlider.position(25, height + 25);
divisionSlider.style("width", "200px");
then set the slices using it
const slices = divisionSlider.value();Linear interpolation
Before I set you loose on today’s practical, I was to talk a moment about linear interpolation
Imagine you have two points on a number line \(A = 0\) and \(B = 1\)
If we are 50% of the way between the two points, where are we? How about at 25%?
What if we have \(A =1\) and \(B = 5\), where is 50% now?
- figure out the distance between \(A\) and \(B\)
- halve the distance
- add it to \(A\)
We can express this as \(A + (B - A)t\)
Why do we use \(t\)? we frequently use this idea for movement, so it makes sense to think about where we are a point in time
Distributing the \(t\)
\[A + ( B - A)t\] \[A + Bt - At\] \[(1 - t)A + Bt\] This looks like proportional weighting
This is used for simplistic animation The animator specifies key frames and then a computer interpolates between the frames
Why “simplistic”? Real movement isn’t linear, we speed up and slow down at the start and end of motions
Interpolation in p5js
This is common enough that Processing includes a function to handle this
lerp(start, stop, amount);There is another one for Vectors, and a special one specifically for handling color
lerpColor(c1, c2, amount);This has two difference from lerp()
- it works between colors (instead of numbers) and is color space aware
- it caps at 0 and 1 so the colors don’t get too crazy (normal
lerpallows us to just use the original two points for scaling)
There is another related function for mapping a value from one range to another. This is not doing the same thing since the value we pass in is not a percentage. however, we could easily use this the same way.
map(value, start1, end1, start2, end2);