CS 105 - Assignment Five
Goals
- Demonstrate your ability to manipulate tabular data
- Use bar charts to answer questions
Prerequisite
There is no starter file required, so you can jump right in with a fresh Snap! editor.
Once you have it open, import the 'Bar chart' library.
Then import the County Demographics data into Snap!
Challenges
Average
Write a block  that computes the average of a list (i.e., adds up the items and divides by the length).
Hint: Contemplate using the combine block. Also, make sure to test you block to make sure it works.
Expectations
- Your block should look exactly like the one pictured above
- Your block should compute the average of a list correctly
Select and aggregate
Now that you have a basic block for computing averages, we are going to make use of it to refine the aggregation operation.
In the exercise, I showed you this example:
In column C, we have lists of the original rows from the table, split by the chosen column or field (so, C on row contains a list of all rows where the first element is 'A').
In the exercise, we took the first two columns, and totally ignored the third column. This was exactly what we wanted for the histogram, and reasonable enough if we want to count elements for the bar chart.
However, we frequently want to do something a little more involved. For example, we might want to find the average of some field after the aggregation was performed. For example, what if we wanted to know the average of the second column for the A rows and the B rows respectively?
As with your efforts to deconstruct the weather report, this will take a little effort. We are going to build up to this.
Select and average
Recall in exercise 10 that we were extracting a column out of a table using the  .
.
If you combine this with your new , you can summarize any field out of a table (select the column, then pass it to your average block).
Create a new block:  .
.
When given a table and a field, it should return the average of all of the values in that field.
Make sure this works before continuing
Reporting tabular data
Our trick with and the  reduces a table down to a single column (i.e., a simple list).
Sometimes we want to return more fields. To do this, we can remember that  is a reporter, even if we just treat it as data.
We can actually combine the and . This example returns a table with just the state and county names in it:

Of course, we don't just have to put in the list cells, we can use any block that makes sense when applied to a row of a table/list...
Try this out so you can see what it does.
Tip These higher-order blocks can be a little confusing with the blank input that receives the items from the list being mapped over. If you are having trouble keeping track, we can make these inputs more explicit. If you click the little arrow in the grey circle, it will open to reveal a new variable. This variable represents the current item, so you can use it instead of the blank input. Here is the example from above making use of it (I renamed the variable row to make it even more explicit what is going on).

Select block
Now let's put this together.
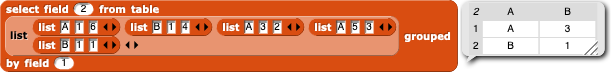
I would like you to construct this block:

This block should report a table with two columns. The first column should contain the field from the last input ("grouped by field"). The second column will contain the selected field. All other fields in the table will be ignored.
Since we are aggregating based on one of the fields (combining together all of the rows of the value), we need to do something about the fact that in the second field we will have many different values. This is where your new comes into play. I would like you to average together the values in the second column.
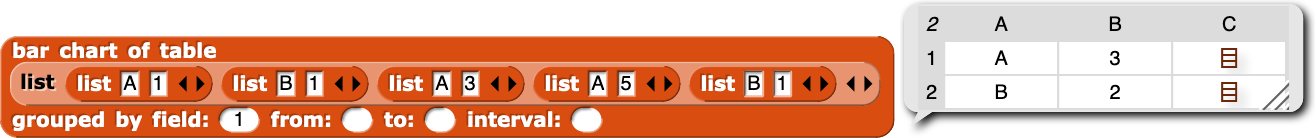
So, for example, given this list:
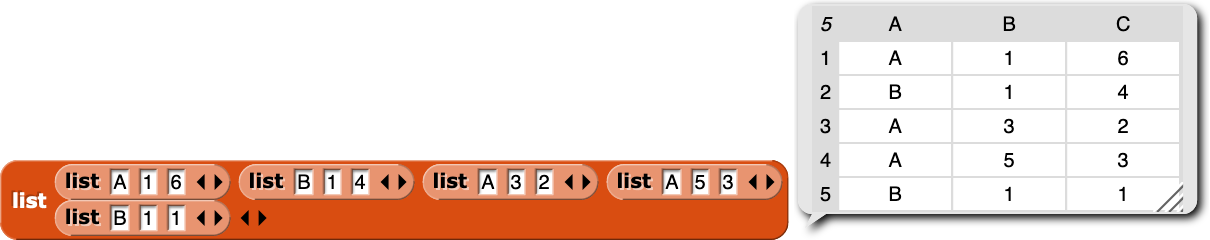
Your block should return something that looks like this:
Use the  (to handle the initial aggregation for you) and the tools we developed above to create the block.
Hint: Take it one step at a time and test at every step of the way. Start with and work from there.
Expectations
- Your block should look exactly like the one pictured above
- The block should return a table (a list of lists, each with two values -- the common name and the aggregated value)
- The "selected" field should be averaged per the groups resulting from combining the identical elements from grouped field
- The block should incorporate the (which should incorporate the )
Build some graphs
Now that you have your new block, I would like you to use it to make some graphs.
I would like two graphs (though you are welcome to make more).
The first graph should show the average percentage of the population with a bachelor's degree, broken out by state.
The second graph should show the home ownership rate, again broken out by state.
Expectations
- There should scripts to build the two charts described above
- As in the exercise, each script should start with a
 so we can just click them and see the result
 - Each script should have a comment attached describing which data set it is visualizing
Exceeding expectations
This one really will require a pretty solid understanding of what is going on in this assignment and Snap! in general. Don't feel obliged to attempt it.
While averaging the values in a column is frequently a reasonable way to summarize the column, it is not the only way. Sometimes, we may want to count up the number of values, or find the maximum, or sum them...
We can actually write our own higher-order blocks that would allow us to pass in other reporters to do these other operations. The only requirement would be that the block be able to summarize a list in some way.
To create a higher block, you just need to change the type of the input. Just as we set the input type to be a list, you can also set the input type to be a reporter. This will give you the little grey ring in your input list.
To use the block inside of your block, you then need to make use of the  . Click the little arrow on the far right of the block to show the inputs. You can then drag your new reporter input into the grey circle on the and then set the inputs on the right.
The blocks
Using this new technique, create a new  . This should do the same things as , it will just apply the input reporter instead of (which is not to say that couldn't be the input reporter).
Once that is working, create a new block:  . It should use the new reporter input to summarize the data.
Submitting
Share the project using the instructions from exercise 1.
Visit the assignment page on Canvas to submit the URL.