CS 105 - Assignment Eight
Goals
- Gain some more experience manipulating sounds
Prerequisite
There is no starter file required, so you can jump right in with a fresh Snap! editor.
Spectrogram
In the lecture, I showed you a couple of different ways to visualize sound. Now you are going to do one more. I would like you to produce a spectrogram.
A spectrogram is essentially a picture of the frequencies present in a sound. In the lecture, I showed you one way to visualize the frequencies of a sound:
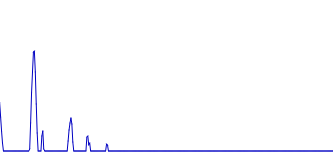
This used the  with the input set to 'spectrum'. This block takes the range of audible frequencies and spits them into bins (like a histogram). The value in each bin is the strength of the frequencies in the range represented by the bin. The number of bins can be read from the 'resolution' input to .
To create the graph above, we walk the sprite across the screen, using the value in each bin to determine the y position, and the location of the bin in the list to determine the x position. I then put this in a loop so the line responds to sound in real time.
I would like you to take the same information and draw it in a different way.
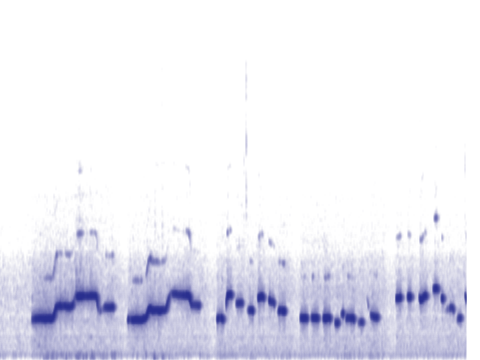
Given the list of frequency strengths, I would like you to draw a column instead of a horizontal line, varying the color based on the value in the bin (really this is just a vertical line that changes color along its length). So, rather than marching along the x axis, using the values to determine the y position, you will march up the y axis, varying the transparency of a color as you go.
Then, rather than clearing, you will move the sprite over one and do another column. This way the x axis is used to show time.
You will end up with a drawing that looks like this:
Here is the algorithm:
- set the pen color
- put the sprite in the lower left hand corner
- loop the rest forever
- put the pen down
- draw a column
- pick the pen up
- go to the bottom of the stage and add 1 to the x position
- if the x position is off the edge of the stage, clear and move x back to the far left
To draw the column:
- loop over the values found with the 'spectrum' setting of
- calculate the transparency based on the current value and set the pen transparency based on this number
- change the y position by 2 (why 2? so that the interesting frequencies are more visible)
- *to speed up the drawing, surround the loop with a

To set the transparency, we need a number between 0 and 100. The max value from the 'spectrum' is 255. So, we need to change scales from 0-255 to 0-100. As perhaps you recall, we can do this by dividing the number by 255 and multiplying by 100. This will get us a number between 0-100. Unfortunately, since we are dealing with transparency, large number are more transparent, which is really the opposite of the look we want. So, subtract the value you calculated from 100.
When this is working, create this block:  .
.
You are welcome to tinker with the coloring of the graph. For example, you could set the hue instead of the transparency for a very different look.
Expectations
- You should have created

- When run, the block will correctly draw a spectrogram
- The drawing should continue forever
Exceeding expectations
When the sprite loops back around to the left side of the stage, don't clear the stage. Just clear the column the sprite is about to draw so you don't see old data shining through the transparency.
Slicing sound
For this challenge, I would like you to implement this block: 
The idea is that we are going to extract a short sample out of a sound. The first input is the number of seconds to be extracted, the second is the sound, and the third is where to start the slice.
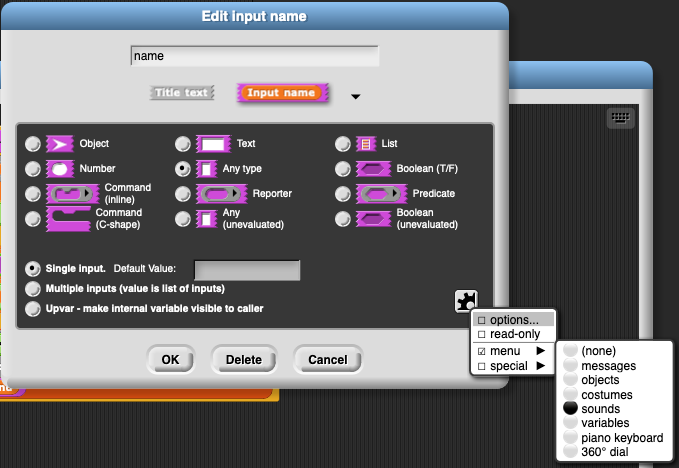
We want the second input to be a menu that lists the recorded sounds. To do this, go into the input editor and click the black triangle to show the different types that we can use. Select 'Any type' if it isn't already selected. Then click the quarter gear image in the lower right, and select Menu, and then Sounds.
In our previous work, we were just working on the raw sample lists. However, for this block, we want a proper sound so we have access to the sample rate (this will be important since the inputs are in seconds). That said, you will need to pull out the raw samples when you do the actually slicing.
There are a number of different ways to perform the slice.
- Using a loop and adding the values one yb one to a new list would work, but it would be slow
- You could use
 , and filter based on the position of the sample in the list now that you know how to access the extra variables in the higher order blocks.
 - The fastest way just uses
 and
and 
Use the one that makes the most sense to you. Which ever approach you try, I would try out on a short list to make sure it works (note that you can't pass the short list into your new block and expect something reasonable, so test with a script that just does the slice first)
Expectations
- You should have created
- The block should return the correct slice from the sound
- The block should work for sounds with different sample rates
Submitting
Share the project using the instructions from exercise 1.
Visit the assignment page on Canvas to submit the URL or the file.