CS 105 - Assignment Four
Goals
- Demonstrate your ability to deconstruct a problem
- Demonstrate your ability to apply abstraction to problem solving
Challenges
Improve JSON access
In exercise 9, you learned how to unpack values from JSON we fetched from the web. The process was a little awkward because of the way JSON data gets split into a list of lists.
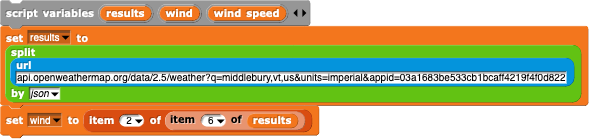
Each item in the main list is a list with two items, the first is the name and the second is the value.
I would like you to create a new block  . This block will report the value of a property based on its name.
For example, if we had a list that looked like this,
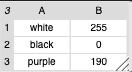
Then  would report the value 0.
If the propety we ask for isn't in the list, this should report nothing (i.e., call  with a blank input).
Hints
Start by thinking about your algorithm. You are going to want to iterate over the list, comparing the first item of each sub-list against the input property name. if you find a match, you want to report it.
Make sure to test your block!
Expectations
- Create a block that looks like this:
- The block should report the value associated with the input property in a deconstructed JSON list
- If the property is not in the list, the block should report nothing
Weather Report
For your second challenge, I would like a short weather report. You are going to again make use of OpenWeather, but this time, we will use the forecast API.
The API call you should use will be:
api.openweathermap.org/data/2.5/onecall?lat=44.02&lon=-73.17&units=imperial&exclude=minutely,hourly&appid=
remember that you need to add the API key in at the end of this URL
Notice that this API requires us to enter in the latitude and longitude of the location rather than the city. I've preset this with the location of Middlebury, but you are welcome to try others.
This API call actually will give us daily, hourly, and by the minute predictions. In the URL above, I have turned off by the minute and hourly. You will find the daily predictions in a property called daily. The value is a list of seven objects, each one a prediction for the next seven days.
Here is the structure of one day:
{
      "dt": 1602086400,
      "sunrise": 1602068273,
      "sunset": 1602109352,
      "temp": {
        "day": 56.03,
        "min": 48.22,
        "max": 57.99,
        "night": 48.22,
        "eve": 57.99,
        "morn": 53.46
      },
      "feels_like": {
        "day": 46.49,
        "night": 41.04,
        "eve": 53.64,
        "morn": 46.45
      },
      "pressure": 999,
      "humidity": 71,
      "dew_point": 46.78,
      "wind_speed": 15.61,
      "wind_deg": 187,
      "weather": [
        {
          "id": 501,
          "main": "Rain",
          "description": "moderate rain",
          "icon": "10d"
        }
      ],
      "clouds": 100,
      "pop": 1,
      "rain": 9.35,
      "uvi": 3.56
    },
I recommend that you take a look at the documentation for more details.
What I would like is for you to write a script that downloads this information and just reports the weather for tomorrow. I would like the average temperature ("day" from the "temp" property), and the "description" from the "weather" property. So, for the above, it would report "56.03 degrees, moderate rain".
You should use  to build a phrase like the one above (though you are welcome to deviate from the exact text).
You should also pick out a new costume for the sprite, so we don't have a weather reporting arrow. You will find the library of Costumes in the main menu.
Expectations
- When the
 is clicked, the sprite should tell the user tomorrows average temperature and the description of the weather.
 - The block created in part 1 should be used
- The should be used to assemble the report
- The sprite should have a different costume on
Exceeding expectations
For this assignment, you can exceed expectations by doing AT LEAST ONE of the following (you do NOT need to do them all)
- Compare the predicted temperature for the next day to day and include "warmer", "cooler" or "about the same" in the report
- Ask the user which city they want the weather for. While this API does not accept the city, the one we used for current conditions did. It also reported back the
latandlon. So you could use the other API to get the geolocation, and then use those values to query this API - Create a collection of costumes for the sprite and change the costume based on the weather conditions
- Draw a line graph of the upcoming week's temperatures. Use the technique we looked at before for switching between two ranges and plot the temperature on the Y axis, with 0 on the bottom and 100 degrees on the top. Then map the days along the X axis, so the seven days stretch across the screen. Finally, draw a line from each new point you read out of the data. Obviously, this is the hardest task of the three, tackle this only if you really get it.
Submitting
Share the project using the instructions from exercise 1.
Visit the assignment page on Canvas to submit the URL.