CS 105 - Exercise Ten
Goals
- Learn how to work with data in CSV form
- Do some very basic exploratory data analysis
Prerequisite
There is no starter code for this exercise, so go ahead and visit https://snap.berkeley.edu/snap/snap.html and make sure you are logged in.
Objective
In this exercise, you are going to explore a CSV file. Your goal will be to download a file and figure out some interesting questions to ask about it and then attempt to answer them using Snap!
Form a group
You will work on this exercise in groups of 2-3. Find someone you did not work with previously.
To make attribute easier, we are going to be a little more formal about your groups on Canvas. Go to Canvas and click on "People" from the menu on the left. When the page loads, click on the "Groups" tab. You should see a list of groups with names like "Exercise 10 group 1". If you are the first of your group to reach this stage, pick an empty group and join it, otherwise join the group started by your partner.
Getting data
The first thing your group needs is some data to work on. I am going to give you a little freedom here to pick a dataset that interests you. Please visit the CORGIS CSV data collection. You are welcome to pick any of the datasets you find on that page. Feel free to click through and look at the available fields in the datasets before you make a choice. Once you have made a choice, you will find a link to download the file at the top of the page. Click it to download the file to your computer. I suggest leaving the page open as a reference to the meaning of the different fields.
Once it is downloaded, drag the file into the script area of the Snap! editor. As in the lecture, you should see it open up in a table view and get stored as a variable.
Form some questions
While you could just poke around at the data, it helps to have some initial questions you are trying to answer. Look at the description of the data and try to come up with at least two questions that you think would be interesting to explore. Keep them within the realm of simple to answer with the data (max, min, average, simple correlations between fields), we will try to get a little more complicated later.
So that we can see the questions, I would like you to record them in Snap as a comment. A comment is a block of text that supplements the script, but is not part of any computation. We usually use them to provide documentation about how blocks work and what we were thinking when we wrote the script. In Snap!, they look like little yellow Post-it notes:

To create a comment, you need to make a secondary click (a right click, a two-fingered click, whatever the gesture is to make the alternative button click on your machine), and select 'add comment' from the popup menu.
Hint: When you are brainstorming questions, don't evaluate them. Don't think "no, that's a stupid question". Just write down everything that comes off the top of the group's heads. After you have a good bunch of them (5+), then winnow it down to the initial two.
Explore the data
Once you have your questions, try using the techniques I showed you in the lecture to answer them. Here are some of the things I showed you:
Remove the header
To remove the header, we have this block:  . As it says, it returns all of the items of a list except for the first element.
Extract a column
To extract a column of data, I made use of the  . Recall that this allows us to map a computation over every element of a list. Since we have a list of lists, we could map the
  onto the elements of the list to get a particular column out (e.g.,
  ).
).
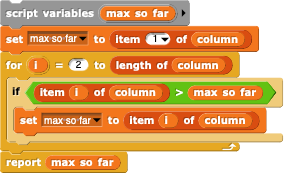
Finding a maximum value In the lecture, I showed you a general technique for finding a largest value in a list. The basic strategy was to walk over the list, item by item, keeping track of the largest number seen so far (pretty much what you would do by eye if I asked you to do it manually). This is what my solution looked like (in truth, this is slightly different from what I showed you in lecture -- but this form might be more helpful later...).
Of course, you won't get very far with only the max value. So write some of your own scripts. I won't mandate what you create -- be guided by the questions you have asked.
Recording your findings
As you answer the questions, create a new comment to report the result. If you can't answer the question because there isn't an answer on the data, or the techniques required are too advanced, write that in the comment instead. In the end, I would like to see two answered questions, and the work that supports it. You aren't required to make new blocks, but if you build something useful, you may find it helpful to package it up.
What I will be looking for
- The workspace should include a new variable containing a dataset
- There should be at least two questions written in comments
- There should be at least two answers written in comments
- The work used to answer the question should be visible and clearly connected to the answer (so we can see the data for ourselves)
Submitting
Share the project using the instructions from exercise 1.
Visit the exercise page on Canvas to submit the URL.