CS 465 - Challenge One
| Deliverable | Due Date |
|---|---|
| Challenge 1 | September 24, 2025 at 11:59 PM |
| Challenge 1 (revision) | October 10, 2025 at 11:59 PM |
Goals
- Get some practice making basic charts
- Start learning to pick apart an existing visualization to figure out how it is made
The first challenge is to reconstruct my Beatles visualization.
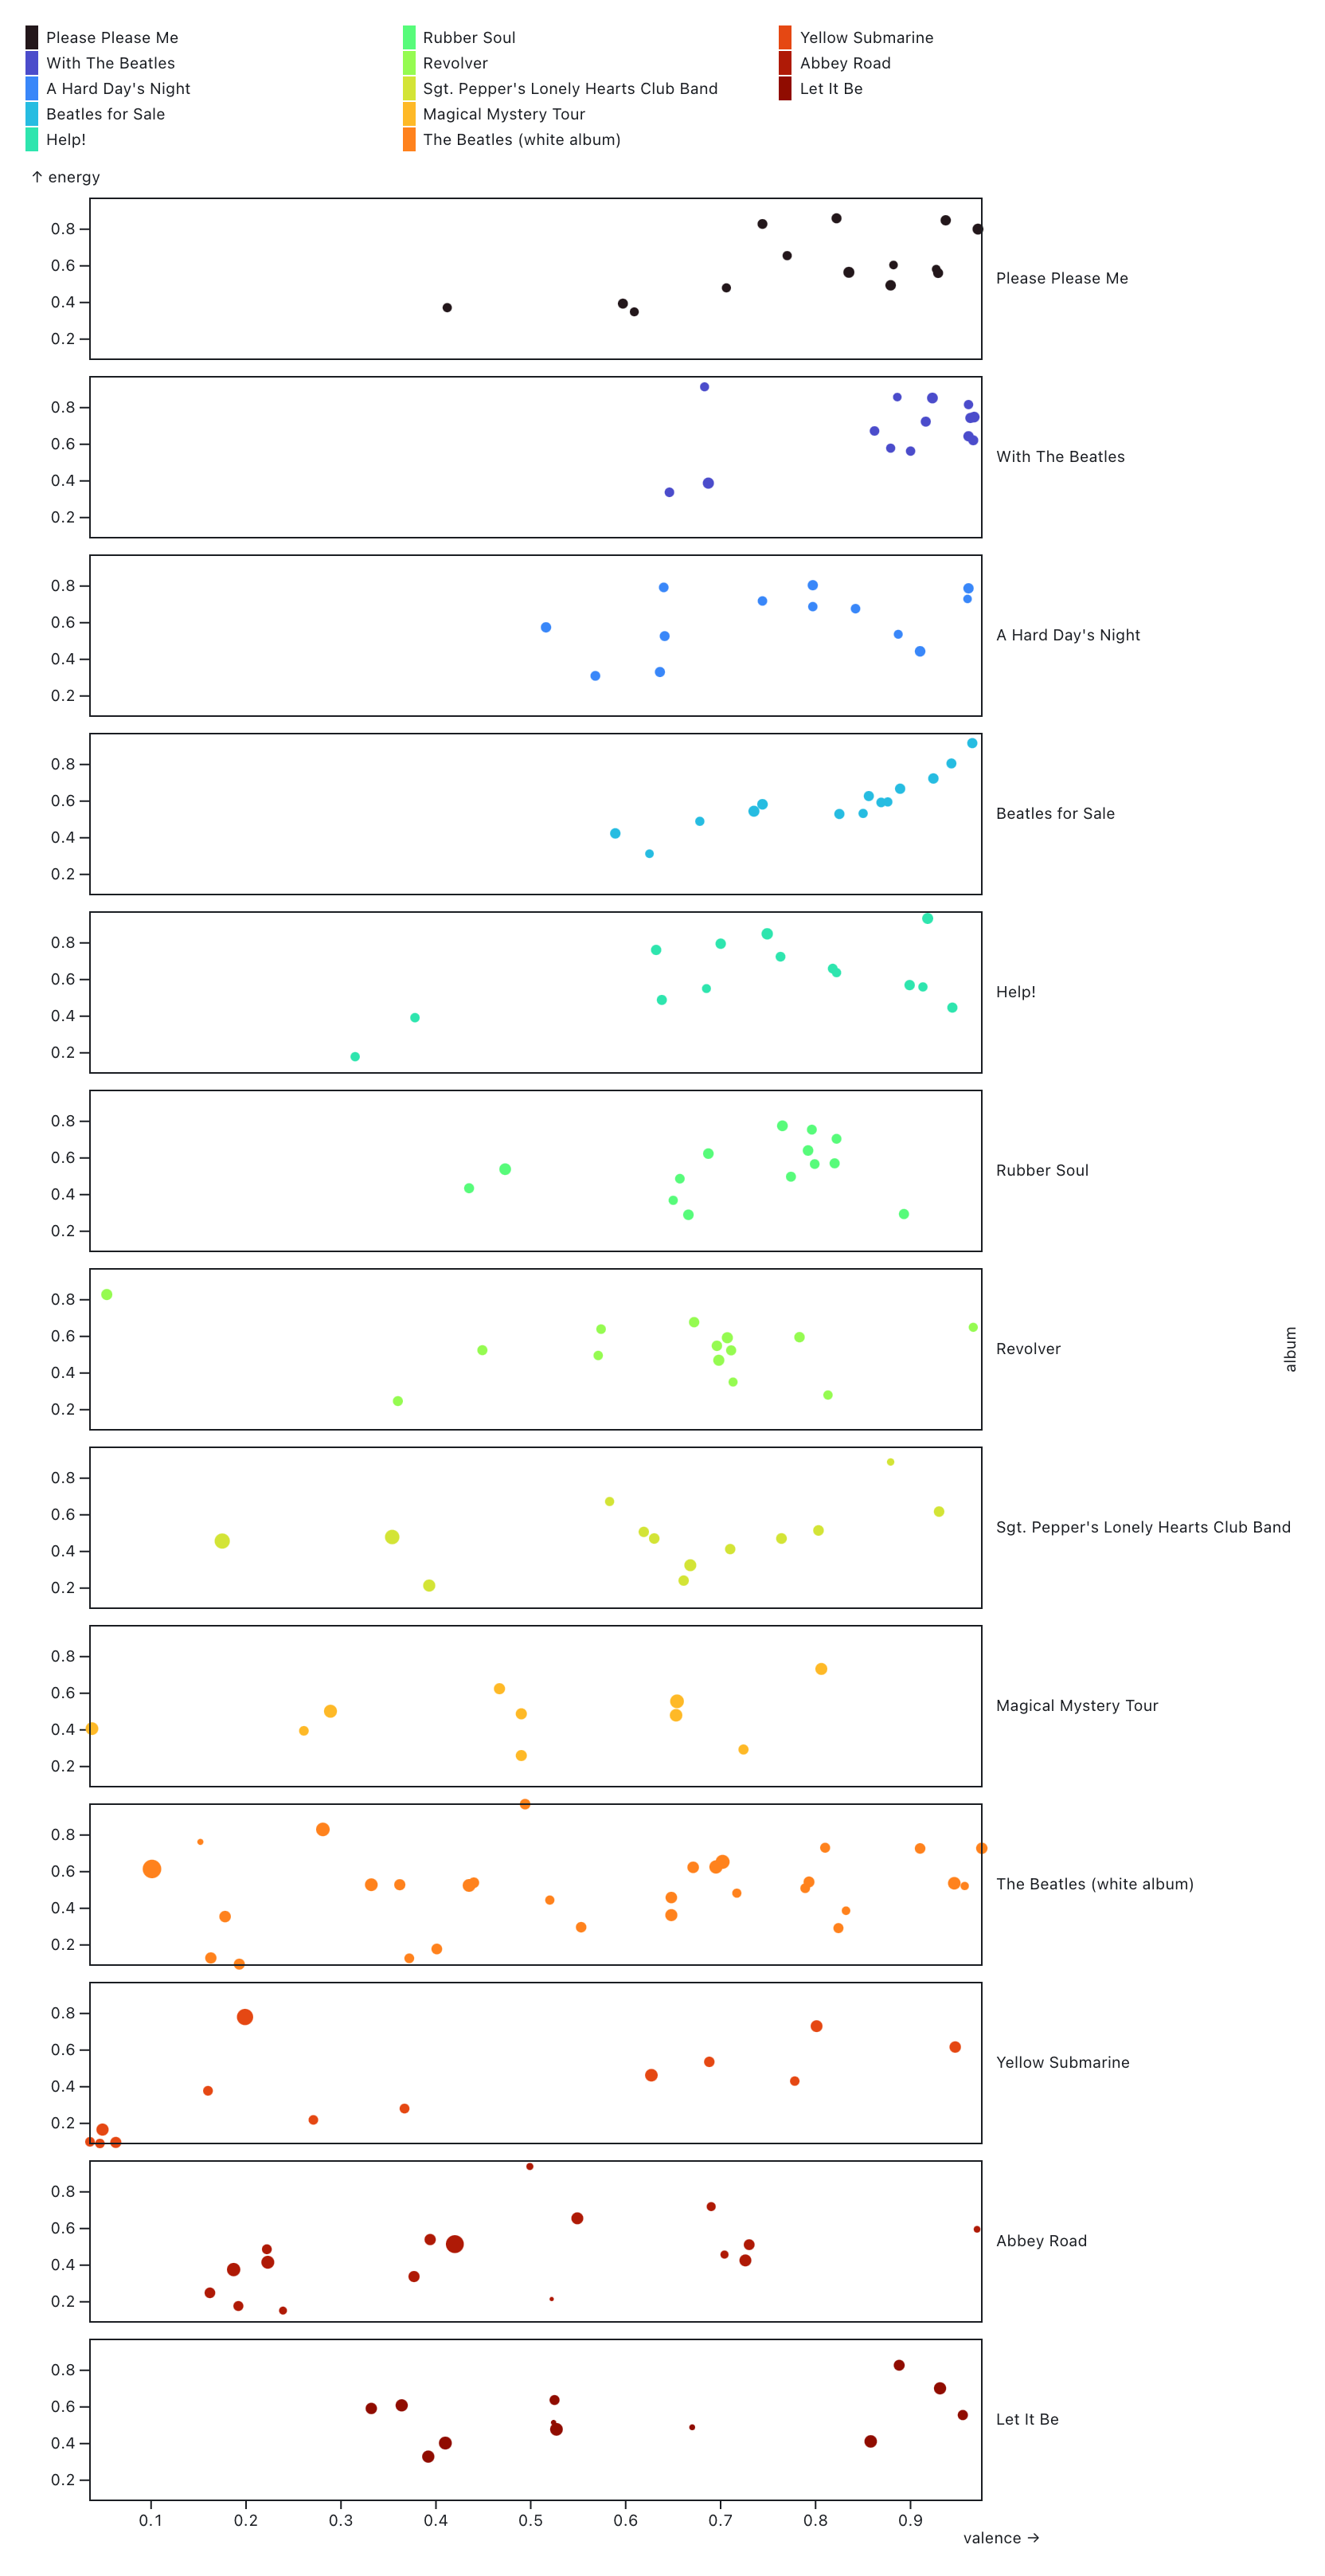
I have set up an Observable Framework skeleton similar to the one you had for Tutorial 01. A key difference, however, is that rather than putting the plot directly into the markdown, I’ve created a function which you will find in src/components/beatles.js. This function is called from src/index.md, and it should return the plot.
- Get the starter code by accepting the assignment from GitHub Classroom
- Clone the repository to your local computer with
git clone - Complete the visualization
- On src/index.md there is a space to add observations about the visualization. Provide at least two insights you have from this visualization.
- Answer the questions in reflection.md
- Commit (
git addandgit commit) your changes and push them to GitHub (git push) - Submit your work on Gradescope
There are some automated tests on Gradescope that will provide a sanity check on your code. I still need to look at it myself, so nothing is finalized until I have checked off on it.