function makeCircle(g, color){
    g.append("circle")
    .attr("cx", 50)
    .attr("cy", 50)
    .attr("r", 25)
    .style("fill", color)
    .style("opacity", 0.5);

    return g; // return the g so we can chain on further methods

}


function makeExample(){
    // make an SVG
    const svg = d3.create("svg")
    .attr("viewBox", [0, 0, 300, 300]);

    // add a g with a red circle
    svg.append("g")
    .call((g)=>makeCircle(g, "red"));

    // add a g with a blue circle that is translated over by 25
    svg.append("g")
    .call((g)=>makeCircle(g, "blue"))
    .attr("transform", "translate(25, 0)");

    return svg.node()
}

makeExample()CS 465 - Challenge Three
| Deliverable | Due Date |
|---|---|
| Challenge 3 | October 20, 2025 at 11:59 PM |
| Challenge 3 (revision) | November 12, 2025 at 11:59 PM |
Goals
- Build your own graph in D3
- Think about using abstraction to help build a complex structure
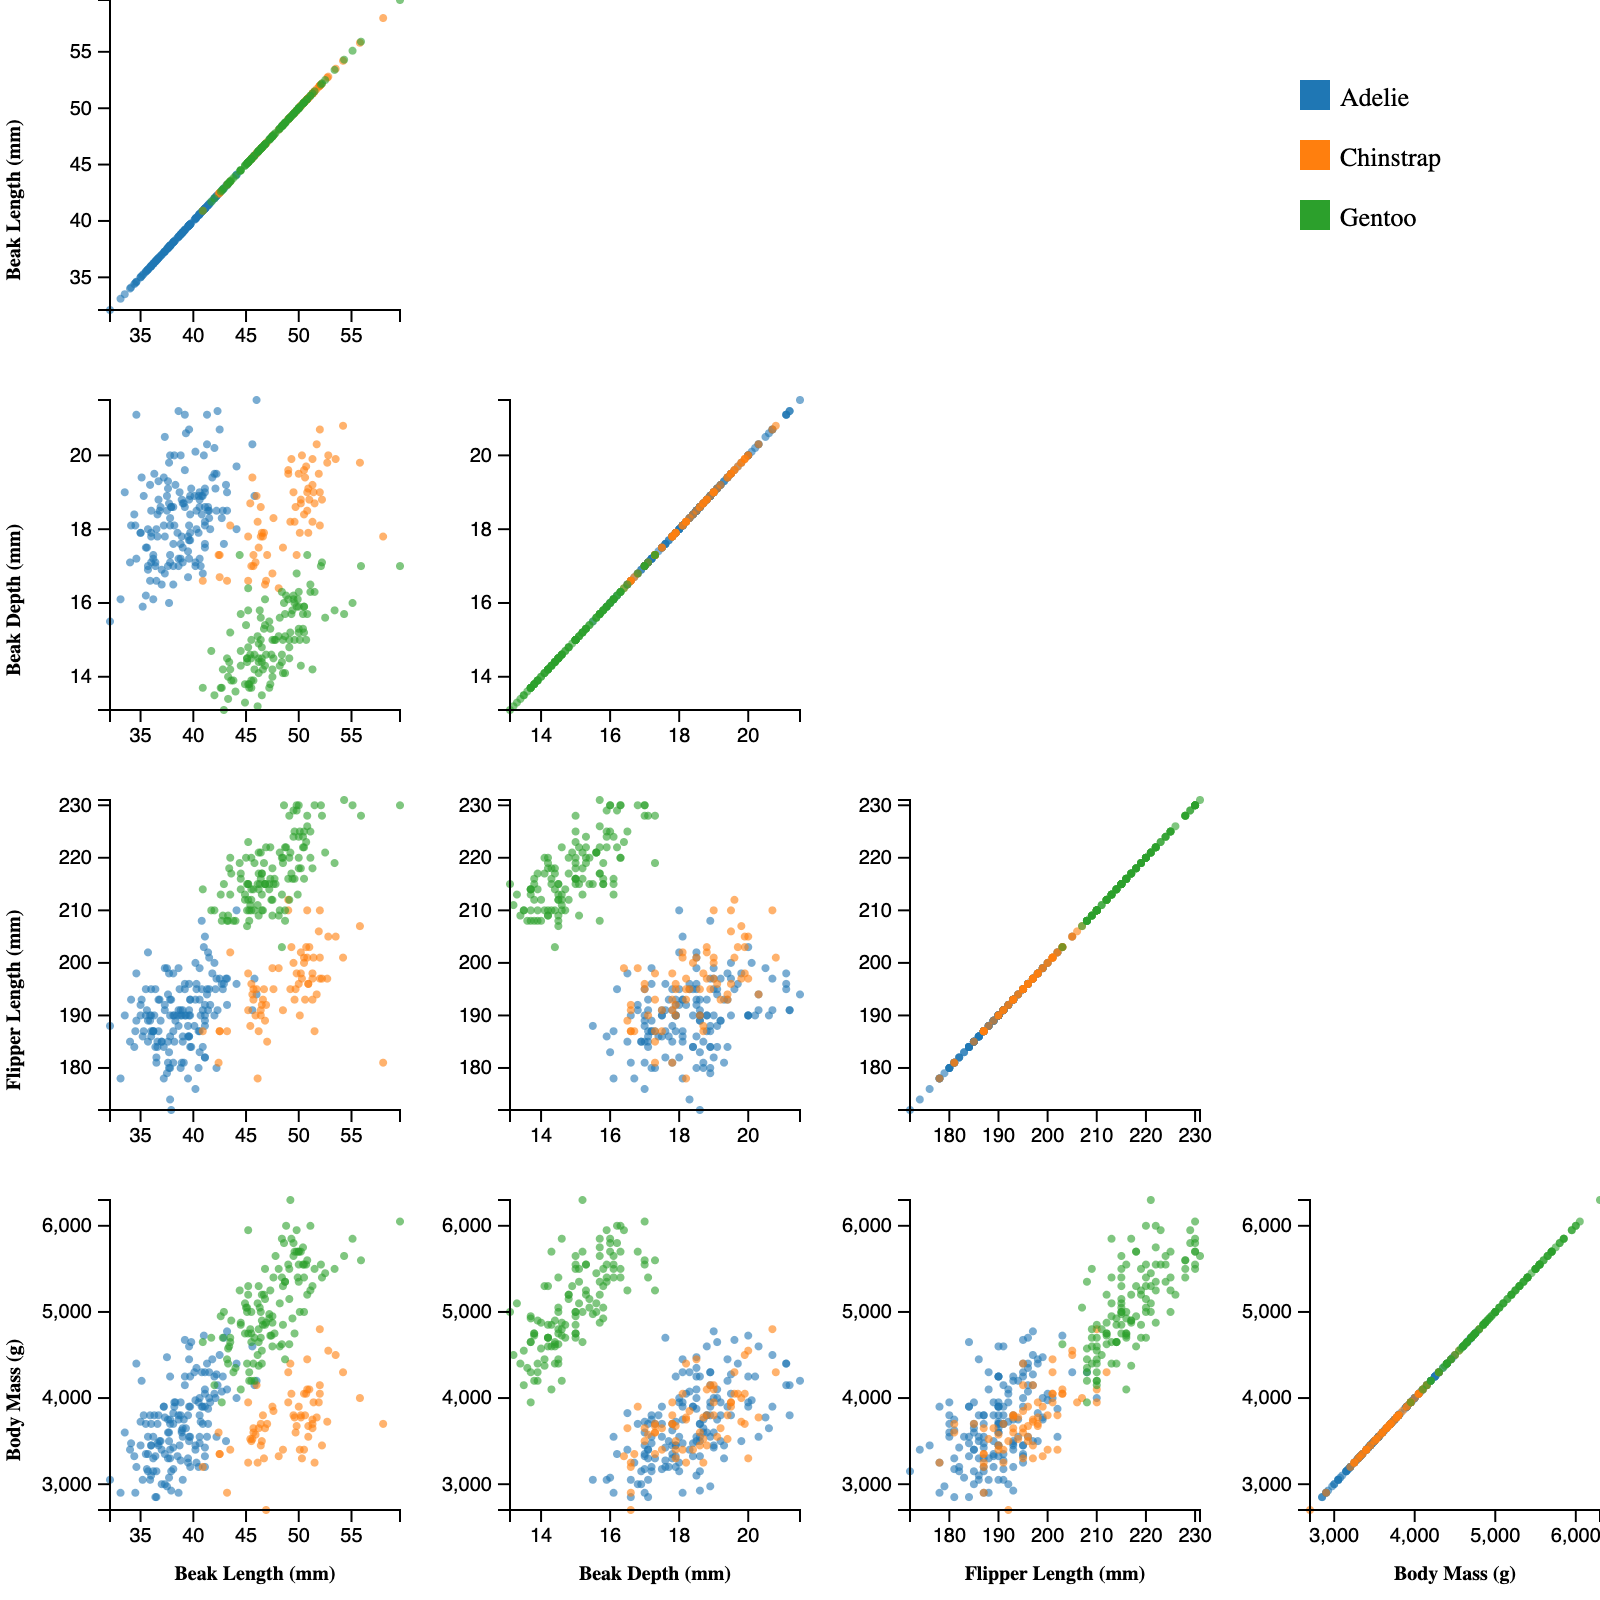
The third challenge is to draw a scatterplot matrix.
I have once again set up an Observable Framework skeleton for you. As with Challenge 1, I’ve created a function which you will find in src/components/visualization.js. This function is called from src/index.md, and it should return the plot.
- Get the starter code by accepting the assignment from GitHub Classroom
- Clone the repository to your local computer with
git clone - Complete the visualization
- Make two observations about the data based on the visualization !. Complete the reflection
- Commit (
git addandgit commit) your changes and push them to GitHub (git push) - Submit your work on Gradescope
There will not be an automated test suite this time. There are a lot of different ways to tackle this problem and it would be too challenging to try to build a robust test with which I had confidence.
Tips and hints
The data we are using is the Palmer Penguins dataset. This is another of the classic data sets used for visualization and classification tasks. As you will see, this time we aren’t importing data from a CSV file, we are just making use of the Vega datasets collection. Two of the penguins have null values for their characteristics, which I have filtered out for you.
While this may look a little complex, part of the point of this challenge is that it really isn’t that difficult to construct. The name of the game here is, of course, abstraction. Write a yourself a generic function that can make a small scatterplot given the two fields (you will probably want some additional arguments beyond just the field names). You will find that you can mostly copy over the scatterplot code you have already developed and make it more generic.
Once you have your function (and have tested it, right?), you can throw it in some loops and iterate over the field names.
- In your function, I recommend creating
gs that contain the subgraph, and returning them from the function. You can then place them using “translate” transforms. (I also recommend not letting your helper function do the placement – just give it enough information to create the graphs.) - Create the labels separately from the graphs. They are just
textelements. - You can control the number of ticks (somewhat) on the axes with the
ticks()function. For example,.call(d3.axisLeft(y).ticks(10))will give you 10 ticks (though D3 may fudge that if it means getting even or whole numbers on the axis) - The legend is assembled by hand using the information in the color scale (which you will need to color the dots)
Aside: The call function
We have not talked about it much, but the call() method is a useful tool that will make this challenge a little easier. We previously saw it when we made the axes on our plots.
Here is how it works: Imagine that we have an SVG g element called container. Image as well that we have a function called draw() that took in a g and added to it. We could call the draw() method with our element (i.e., draw(container)). The call() function allows us to invert this structure. We pass call a function, and it then calls the function on the element we are invoking call on. So, for example, we can write container.call(draw). This does not seem like a big win. However, if the draw function returns the element that was passed in, we can now use it as part of a method calling chain (e.g., `container.call(draw).style(“fill”, “green”)).
This get a little more complex if we want to mix in additional variables to the function. In D3, functions like d3.axisLeft manage this by taking advantage of the fact that functions are objects, and adds further methods (like the ticks() method seen above). However, for simple things, we can get by with an anonymous function.