Programming Assignment 9: Zipf’s Law
Initial Due Date: 2024-11-21 8:00AM
Final Due Date: 2024-12-09 4:15PM
Note: This assignment is an individual assignment.
Background
George Kingsley Zipf was a linguist who noticed an interesting phenomenon regarding the frequencies of words in a corpus (collection of documents). For almost any corpus the frequency of the occurrence of a word (i.e., how many times it occurs) is inversely proportional to the word’s frequency rank in the corpus, i.e.
\[\text{word frequency} \propto \frac{1}{\text{word rank}}\]
For example, the most frequent word (rank of 1) generally occurs twice as many times as the second most frequent word (rank of 2), etc.
This phenomenon tends to show up not only in text data, but in a variety of naturally occurring data ranging from search engines queries to connections in social networks. This phenomenon is so predominant that is has been coined Zipf’s law.
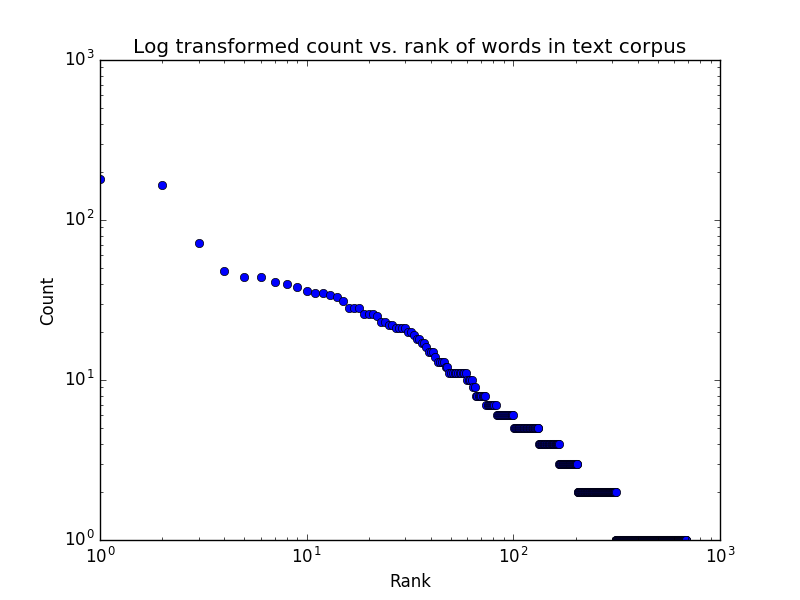
Zipf’s law is most easily observed by plotting the data on a log-log plot. In this form we would expect a linear relationship of the form:
\[\log{(\text{word frequency})} \propto -s\log{(\text{word rank})}\]
where s is a constant that depends on the language, but we should expect to be approximately 1. In this assignment we will write a program to generate a log-log plot for a text corpus, like shown below for the Grimm’s fairytale “Hansel and Gretel”.
Specification
For this assignment, you will be writing a program that reads text data from a file and generates the following:
- A plot like that shown above, that is a log-log plot of word count versus word rank.
- A printed list (i.e., printed using
print) of up to the 10 most frequent words in the file in descending order of frequency along with each word’s count in the file. The word and its count should be separated by a tab ("\t").
Your program must include the following functions:
read_corpuswhich takes a filename as a parameter and returns a list of cleaned and normalized words (see below for more details).count_and_rankwhich takes a list of words as a parameter and returns a tuple containing a list of words and a list of counts for those words. Both lists should should be sorted in decreasing order of count, i.e. the most common word and its count should the first element of the lists. For example:>>> count_and_rank(["a", "a", "the", "a", "in", "the"]) (['a', 'the', 'in'], [3, 2, 1])count_and_rankshould not plot or print anything to the shell.
Your program should take the name of the file as a command line argument. Your program should then count the frequencies of the words in this file, generate a graph using Matplotlib with appropriate x-axis and y-axis labels and an appropriate title, and print out the 10 most frequent words. As in previous assignments your program should not do anything when imported except defining functions (i.e. it should not print, generate a plot, etc.). Your program should only read the file once (to avoid repeating any computations).
Punctuation, e.g. periods, commas, quotes, etc., can bias our word counts and so needs to be removed prior to counting. For simplicity hyphens and other punctuation within words, e.g. the “-” in “wood-cutter” or the “?--” in the paragraph below, does not need to be removed (i.e., we will only remove punctuation at the beginning and end of words, not within words). Note that apostrophes in contractions, e.g. “I’ll”, should not be removed (as it would change the word). We want to reuse existing code whenever possible. We might expect that Python already has a source of all possible punctuation, and indeed the string module has a constant punctuation you can use.
Similarly capitalization can bias word counts. Your program should convert all words to lower case to ensure that “The” and “the” are treated as the same word.
For example, given a file with the first paragraph of Hansel and Gretel (download):
Hard by a great forest dwelt a poor wood-cutter with his wife and his
two children. The boy was called Hansel and the girl Gretel. He had
little to bite and to break, and once when great dearth fell on the
land, he could no longer procure even daily bread. Now when he thought
over this by night in his bed, and tossed about in his anxiety, he
groaned and said to his wife: 'What is to become of us? How are we
to feed our poor children, when we no longer have anything even for
ourselves?' 'I'll tell you what, husband,' answered the woman, 'early
tomorrow morning we will take the children out into the forest to where
it is the thickest; there we will light a fire for them, and give each
of them one more piece of bread, and then we will go to our work and
leave them alone. They will not find the way home again, and we shall be
rid of them.' 'No, wife,' said the man, 'I will not do that; how can I
bear to leave my children alone in the forest?--the wild animals would
soon come and tear them to pieces.' 'O, you fool!' said she, 'then we
must all four die of hunger, you may as well plane the planks for our
coffins,' and she left him no peace until he consented. 'But I feel very
sorry for the poor children, all the same,' said the man.
Your program should produce the following graph:
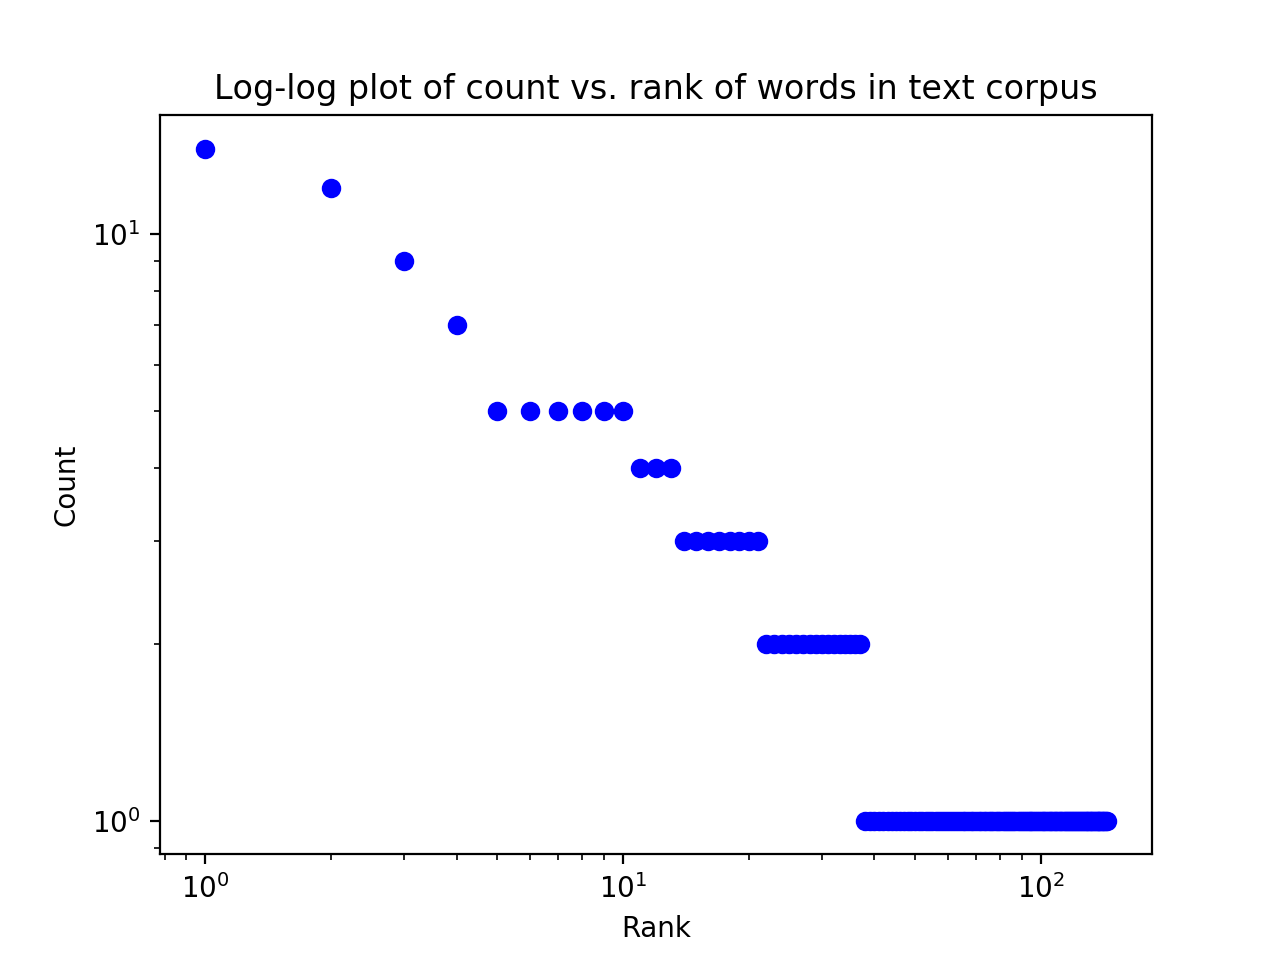
and the following printed output:
Word    Count
the 14
and 12
to  9
we  7
he  5
children    5
his 5
will    5
them    5
of  5
Your program should always print the 10 top-ranked words (and no more, even if there are words, like above, with equivalent counts). Your program should also handle the unlikely case that there are fewer than 10 words.
Several words will likely have the same frequency (or count), but should not have the same rank. The ordering among words with identical counts can be determined in any way, e.g. both “RANK1” and “RANK2” below are valid rankings, as long as the global ranking is correct. Thus your output may be different from that shown above (e.g. “his” could be ranked above “children”).
WORD   COUNT   RANK1   RANK2
the    4       1       1
and    3       2       3
a      3       3       2
is     2       4       4
If you create a NumPy/datascience implementation as part of your creativity additions, you must also keep your implementation using Python built-in functions (i.e. you would have two implementations). Thus make sure your built-in implementation is working before you tackle NumPy/datascience.
Guide
As our assignments get more complex, the descriptions are less prescriptive, giving you more flexibility in how you implement your solution. As you design and implement your program, think carefully about how you can break up your program into smaller functional units (i.e., functions) and how those functions will interact. In this assignment, the style evaluation will increasingly take into account your overall design.
Some notes and suggestions
Your first step will be to read the file into a suitable data structure.
When opening a text file for reading, you can avoid errors related to the character encoding by using either:
with open(filename, "r", encoding="utf-8") as file:or
with open(filename, "r", errors="ignore") as file:The
splitmethod can be called on a string and returns a list of the words in that string separated by any whitespace (e.g. a space).The
stripmethod can take an optional argument, a string of characters to strip from the beginning and end of the string. For example:>>> "word.".strip(".,") 'word'removes any leading or trailing periods and commas. Your actual program will need to be able to strip more punctuation than just the comma and period shown here.
As we saw in class, dictionaries are a very effective data structure for counting the occurrences of different values (e.g. different words).
To generate the ranking you will need to sort the word-count pairs by counts. There are several approaches to do so. The optional readings describe one approach that is based on inverting the dictionary, another is to sort (with the
sortmethod orsortedfunction) a data structure derived from the dictionary, another still is to write a function that finds and removes, e.g. “pops”, the key-value pair with the maximum value (and then applies that function until the dictionary is empty).I think the “middle” approach using
sortedwill be the most straightforward. To do so, you can use the optionalkeyparameter forsortedas described here. This parameter expects function that can be applied to every element to obtain the key that is compared to determine the sort order. For example the following would sort the list ofstringsbased on the second letter of the string.def second_letter(elem): return elem[1] strings = ["yw", "ac", "fg", "de"] strings.sort(key=second_letter)When you invoke Matplotlib’s
showfunction, your program will wait until you close that window (and then proceed). This is normal and expected. It may be helpful to print your “top 10” before plotting so that don’t have to remember to close the plot for the rest of your program to execute.To generate a log-log plot you can use Matplotlib’s
xscalefunction andyscalefunctions with the string'log'as the argument. This transforms the axes without needing to modify the data. Depending on your aesthetic choices for points, etc. your plot might look a little different than the examples - that is OK. But the data should be correct and the axis and title labels meaningful.You should only read the file and compute the counts once, that is the plotting and the printing shouldn’t read the file separately or recompute the counts (doing either multiple times is computationally inefficient).
Data
Here are several text files you can use for testing, derived from public domain texts at Project Gutenberg:
- “Hansel and Gretel” from the “Grimms’ Fairy Tales” by Jacob Grimm and Wilhelm Grimm
- “An Inquiry into the Nature and Causes of the Wealth of Nations” from the book of the same name by Adam Smith
Per the Project Gutenberg license, the above eBooks are for the use of anyone anywhere at no cost and with almost no restrictions whatsoever. You may copy it, give it away or re-use it under the terms of the Project Gutenberg License included with this eBook or online at www.gutenberg.org.
The second is much longer than the first. I suggest you start with the smaller files first - make sure your program is working correctly and efficiently - then tackle the larger dataset. You can also pick interesting inputs of your own from Project Gutenberg or other sources.
Creativity points
Here are some possible creativity additions, although you are encouraged to include your own ideas. Make sure to document your additions in the docstring comment at the top of the file.
- [0.5 point] Incorporate the filename in the plot title in a meaningful way, e.g. “Log-log plot of count vs. rank of words in hanselandgretel.txt”
- [0.5-1 point] Add a fixed line representing Zipf’s law to the plot as a reference. Attempt to approximate the y-intercept to get the maximum points.
- [2 points] Use datascience table to compute counts and rankings. If you add a vectorized implementation, you must also retain an implementation using the Python built-ins. You will want to investigate the
groupmethod to implement the histogram. You can change the column names for a Table with therelabeledmethod. To select just a subset of rows, check out thetakemethod. When you are printing your Table, investigate theas_textmethod. Although that method separates columns with a “|” by default, you can change thesepparameter to use tabs instead. - [2 points] Perform a linear fit on the log-transformed frequency and rank data to determine s and the intercept. Add your fit to the plot. You will want to investigate the NumPy log, exp and polyfit functions.
When you’re done
Make sure that your program is properly documented:
- You should have a docstring at the very beginning of the file briefly describing your program and stating your name, section and creativity additions.
- Each function should have an appropriate docstring (including arguments and return value if applicable).
- Other miscellaneous inline/block comments if the code might otherwise be unclear.
In addition, make sure that you’ve used good code design and style (including helper functions where useful, meaningful variable names, constants where relevant, vertical white space, removing “dead code” that doesn’t do anything, removing testing code, etc.).
Submit your program via Gradescope. Your program program file must be named pa9_zipf_law.py. You can submit multiple times, with only the most recent submission (before the due date) graded. Note that the tests performed by Gradescope are limited. Passing all of the visible tests does not guarantee that your submission correctly satisfies all of the requirements of the assignment.
Gradescope will import your file for testing so that make sure that no code executes on import. That is when imported your program should not try to read the file, generate the plot, etc.
Grading
| Assessment | Requirements |
|---|---|
| Revision needed | Some but not all tests are passing. |
| Meets Expectations | All tests pass, the required functions are implemented correctly and your implementation uses satisfactory style. |
| Exemplary | All requirements for Meets Expectations, 2 creativity points, and your implementation is clear, concise, readily understood, and maintainable. |
FAQ
What is a fixed line representing Zipf’s law?
Recall that Zipf’s law postulates the following relationship:
\[\log{(\text{word frequency})} \propto -\log{(\text{word rank})}\]
To evaluate that hypothesis we could plot a fixed line with slope of -1 in log space alongside our data. Presumably that line will have a similar slope as the actual data. Think about how you could use the actual data to approximate meaningful “y values”. Zipf’s law implies that the second most common word is half as common as the most common word and the third most common is a third as common as the most common word. What does that imply about the counts for the second and third most common words (and the nth most common word)?