Programming Assignment 2: Turtle graphics
Initial Due Date: 2024-09-26 8:00AM
Final Due Date: 2024-10-10 4:15PM
Background
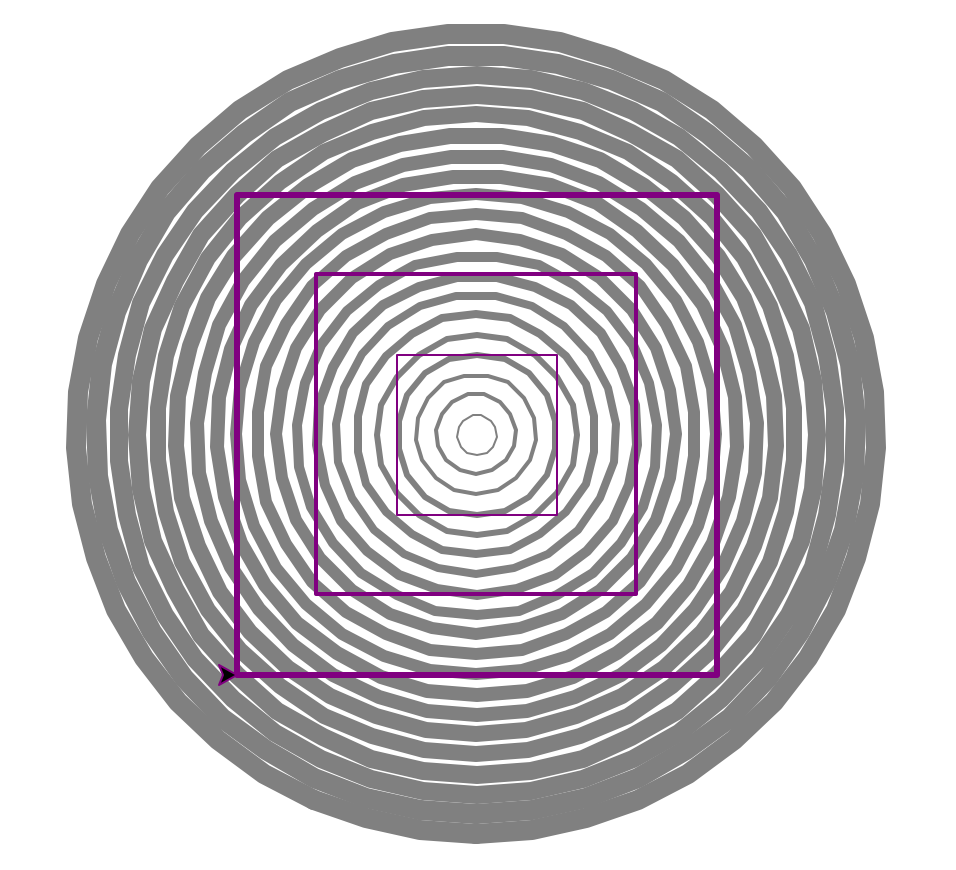
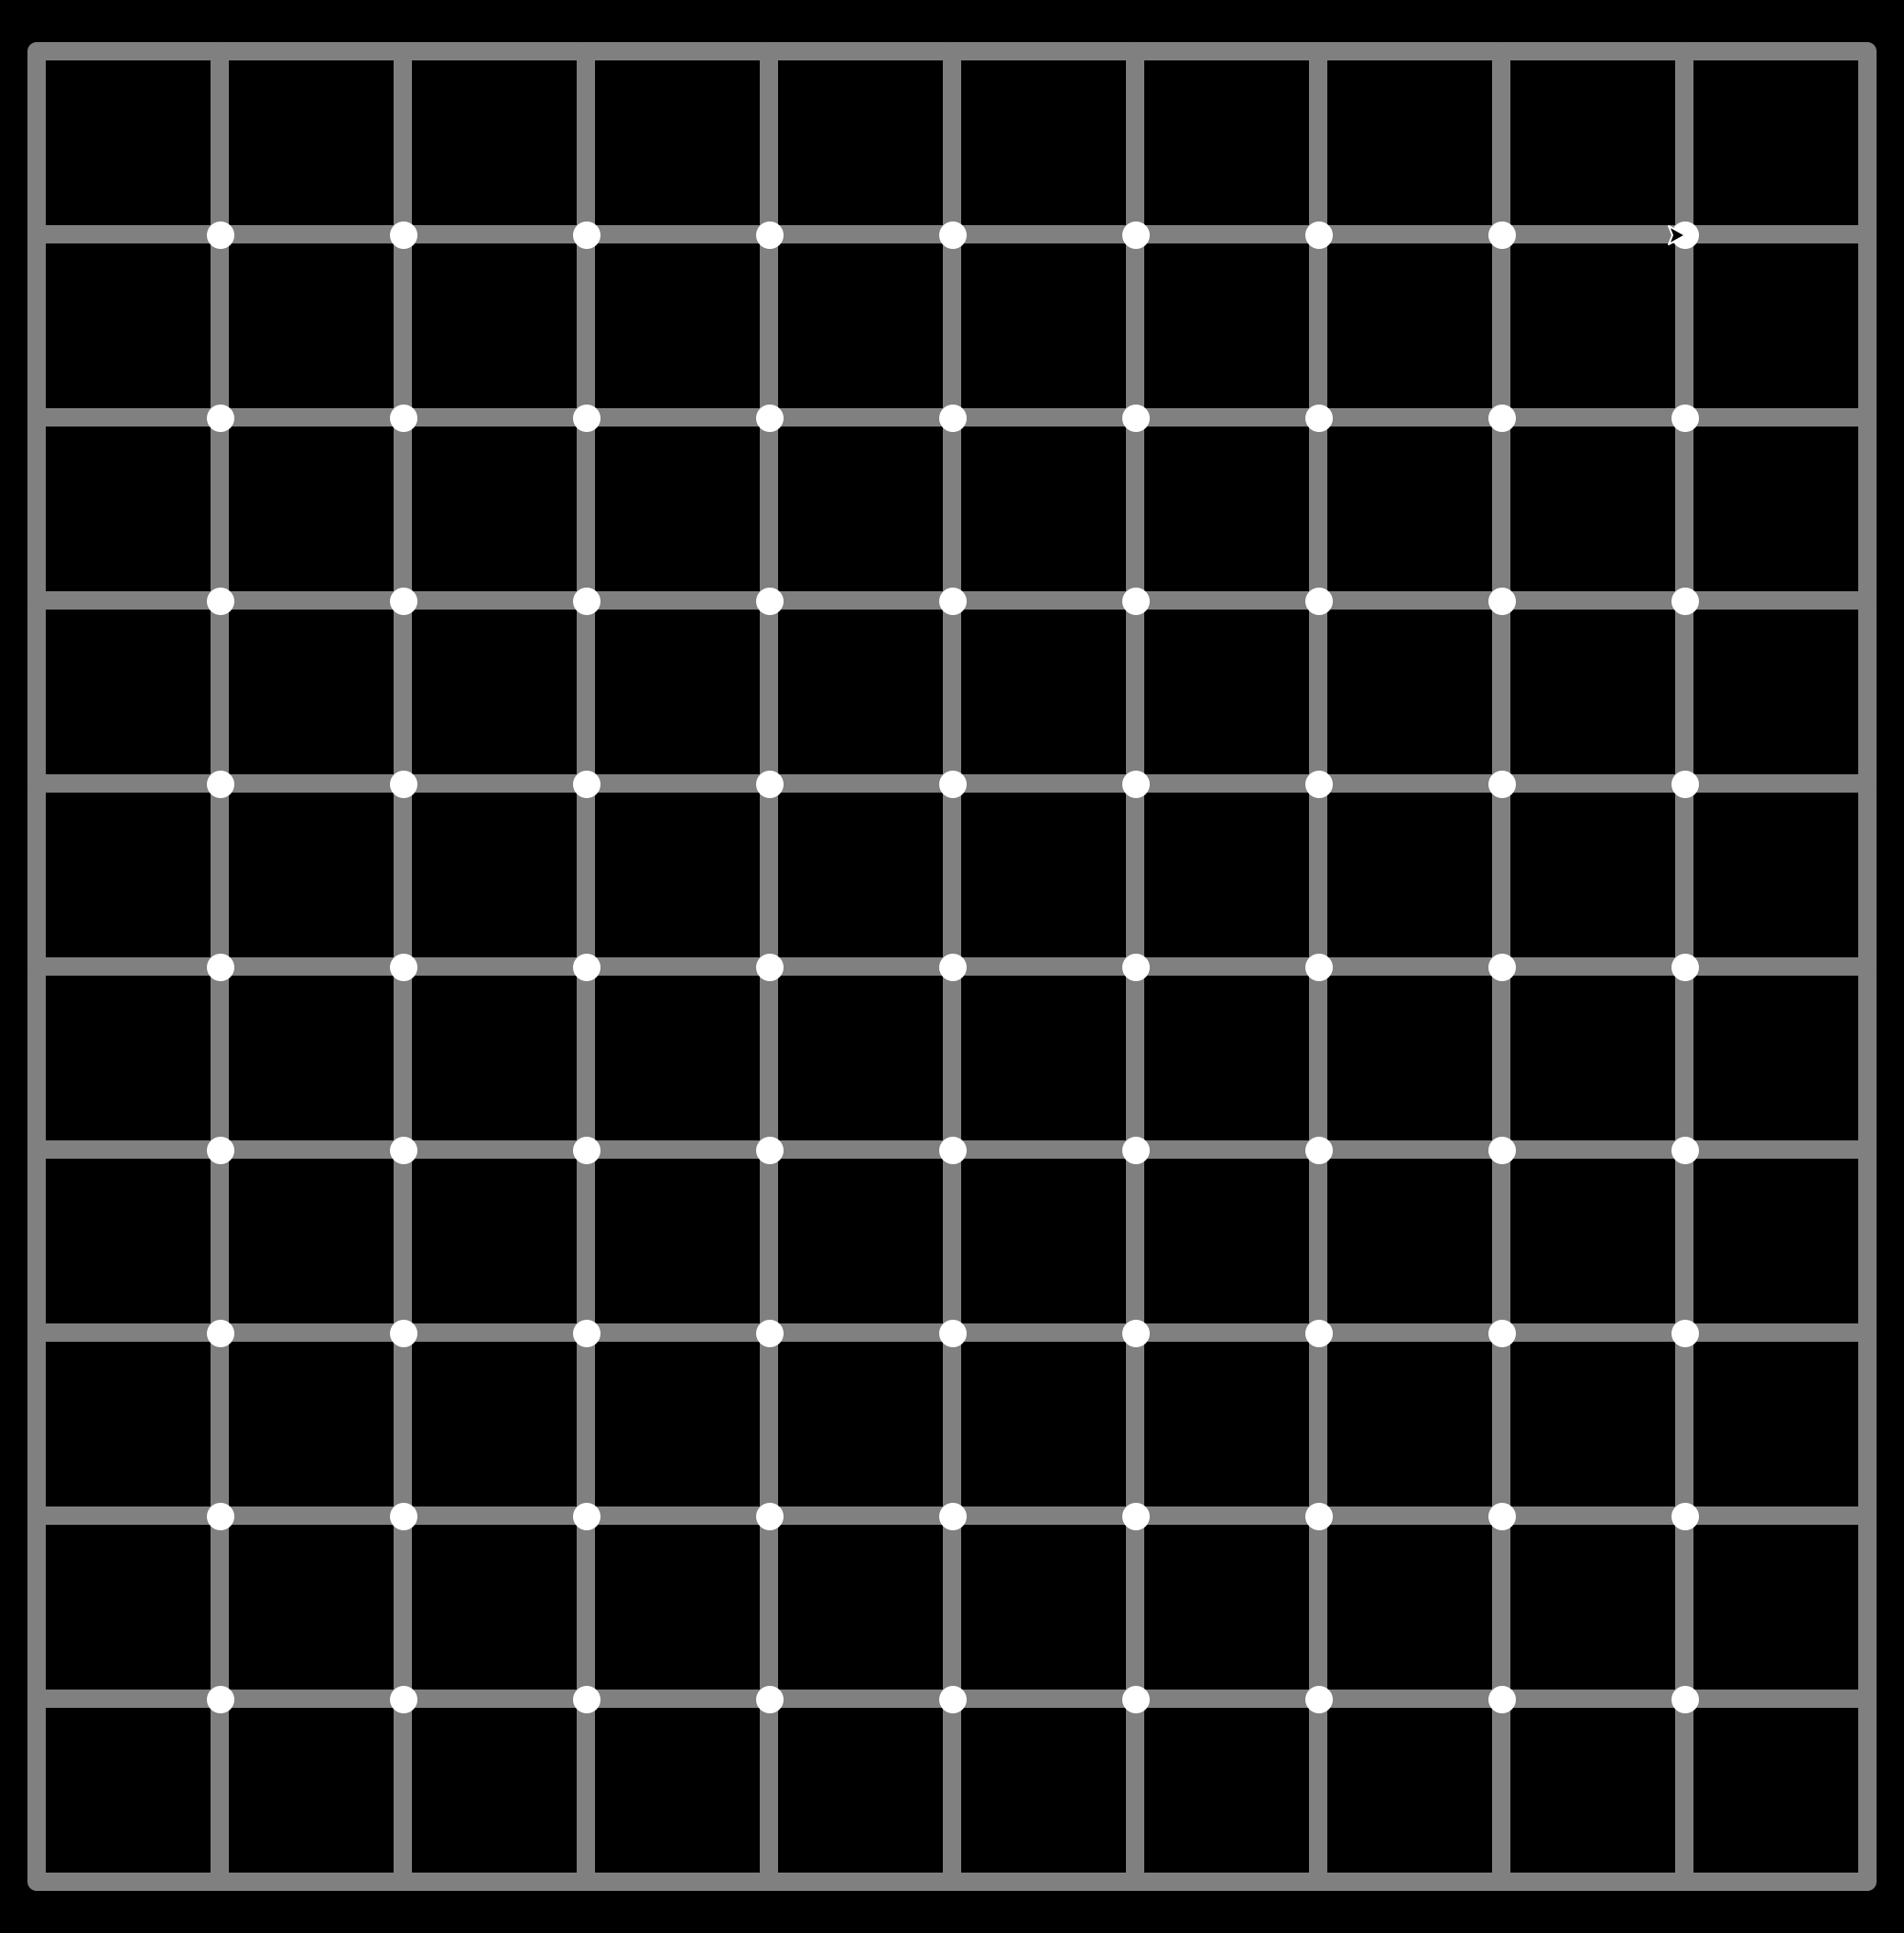
For this assignment, we will be using the turtle graphics module to draw the set of optical illusions shown below. In the left example, the edges of the purple squares look like they curve, but they really are straight! And the black dots that may appear in each white circle (at the intersections) in the example on the right are actually illusory!
Guide
There are three required functions you must implement according to the specifications given below: polygon, curving_squares and pulsing_grid.
Style
Before you start coding, a few brief comments on style. Make sure you keep the following in mind as you’re writing your program:
- All functions should have appropriate docstrings
- All imports should be at the top of the file
- Include a comment at the top of the file with your name, section, and assignment number like that in the PA1 starter
- Use block/inline comments to explain otherwise unclear parts of your code
- Follow the variable naming conventions discussed in class (e.g. lowercase with underscores for variables, parameters and function names) and use meaningful names
- Use whitespace appropriately to make your program easier to read, e.g. blank lines around function definitions and to separate blocks of code within a function with different purposes
- Use constants. If there are values that don’t change within your program (or might only change infrequently) you should define capitalized constants for these at the top of your program. For example, many of the size/spacing values are good candidates for constants.
- Keep it DRY (Don’t Repeat Yourself). If you find yourself duplicating code (i.e. copying and pasting code), think “function”. Could you replace that duplicated code with a function? For example, do you have duplicate code to move the turtle without drawing?
Polygon
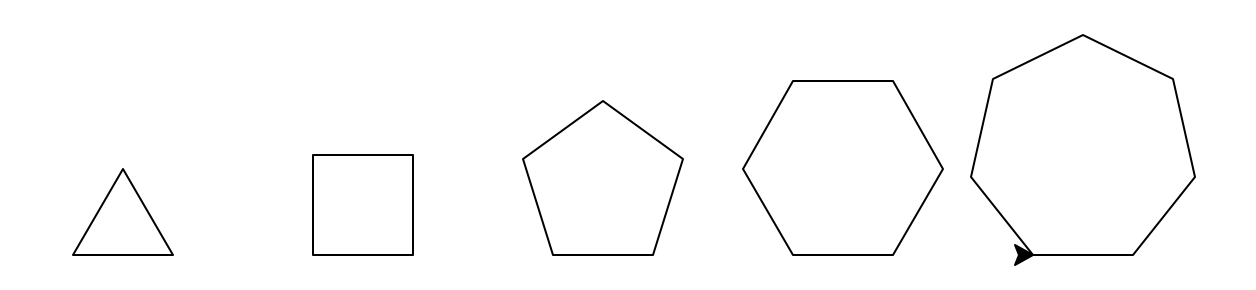
To get started, we’re going to write a function to create a polygon. Why a polygon if what we ultimately need is a square? We will observe that only small enhancements are needed to write a function that solves a more general class problems (draw any polygon instead of just a square), and thus is more useful! Make sure that you get this working before moving on to the next part. I encourage you to refer to the Turtle online documentation along the way.
Include the import statement for the turtle module at the top of your file. Here we will specify the shortened t for the module, i.e., to draw a circle we would invoke t.circle(). This import style minimizes the chances for naming conflicts as all the functions are still in their own namespace (t), while also minimizing the amount of typing.
import turtle as tWrite a method named polygon that draws a polygon. An n-sided polygon has n equal length edges and the angle between a straight line drawn from one side and the adjacent side is \(\frac{360}{n}\). Your function should take exactly 4 parameters:
- the
xandylocation to draw the polygon, - the number of sides, and
- the length of the each side.
The x and y coordinates should correspond to the bottom left corner of the polygon and the bottom side should be horizontal (see the examples below). Unlike some of the drawing functions we saw in class, you can’t “hard-code” the line segments. Instead, you’ll need to use a for loop. To maintain the “invariant” that the bottom edge is horizontal set the turtle’s position and heading as part of the polygon function. Doing so as part of your function is more robust than assuming the turtle is already facing in the correct direction; in general, try to avoid relying on the caller for correct operation of your functions.
“Curving Squares”
Write a function curving_squares with no parameters to generate the “curving squares” illusion above (left). We will tackle it in two steps:
- Drawing the background circles
- Draw the purple squares
If we look closely at the drawing, we see that the background is a series of equally spaced grey circles with increasing pen thickness. Start implementing your function by creating a for loop to draw concentric circles with radii from 10-200 inclusive, spaced apart by a distance of 10 (i.e., the radius increases by 10 for the next larger circle).
Often the first decision we have to make when designing a loop like this is what will our loop variable represent? In this context, will it be the circle index (i.e., 0, 1, …), the circle radius, or something else? Since the radius is the key piece of information, it is likely a good choice. Can you define a loop sequence that contains the range 10-200 inclusive, stepping by 10?
The t.circle function will draw a circle with a specified radius, but it starts drawing at the bottom of the circle. Think about how you can implement your loop to draw concentric circles. Where should the turtle be positioned when you start drawing the circle?
The thickness of the line should linearly increase from 1 (for a 0 radius circle) to just touching the adjacent circle for the largest radius, i.e., its width should the same as the spacing. We can model the width as a line (i.e., \(y=mx+b\), where \(y\) is the line thickness and \(x\) is the circle radius) that passes through (0,1) and (200,10). How could you compute the slope and intercept for that line? Note that the outermost circles might not touch perfectly due to the inherent imprecision mapping a continuous function like a circle to the discrete pixels that make up the screen. That is OK.
You can set the line color with the t.pencolor function. Here we are using "grey", e.g., t.pencolor("grey").
The next step is to draw the 3 purple (t.pencolor("purple")) squares. These too should be concentric and have side lengths of 80, 160 and 240 with line (pen) sizes of 1, 2, and 3 respectively. Add a second loop to your curving_squares function to draw the squares. Your loop should use the polygon function you wrote previously. Think about how you can use the loop variable to determine the pen size, the position and the side length, i.e., can you define expressions for each those quantities in terms of your loop variable. For example, if your loop variable is the pen size, and your loop sequence is 1, 2, 3, then the side length could be 2 * size * 40.
At this point your function should be complete and exactly match the example above. The positioning/size on your screen might appear slightly different (due to screen size and resolution). That is OK!
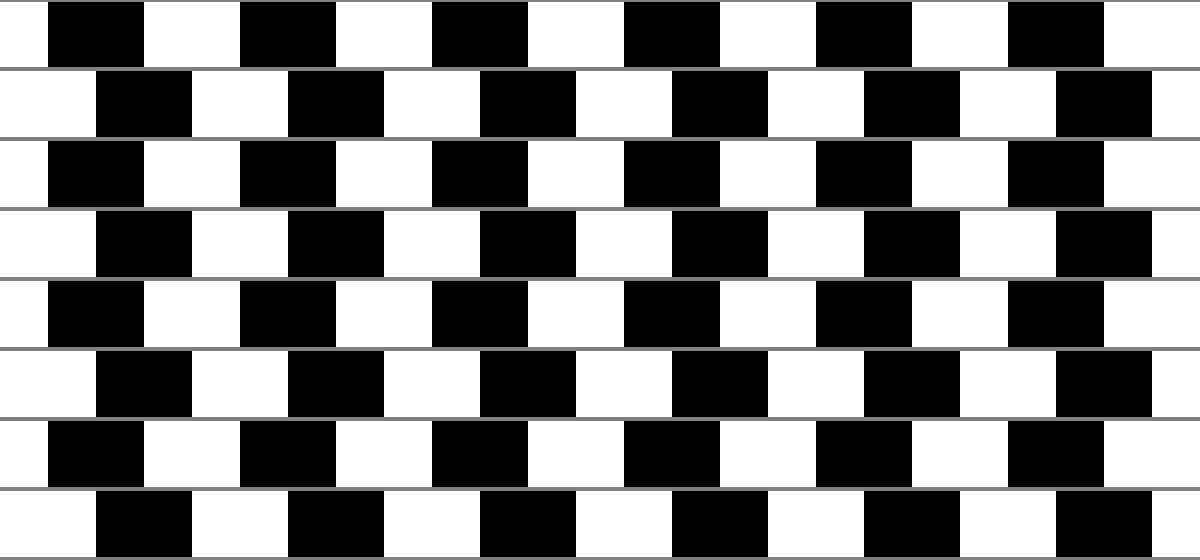
“Pulsing Grid” or the Hermann scintillating grid
Write a function pulsing_grid with no parameters to generate the Hermann scintillating grid illusion above (right), albeit with a random grid size (in the range 5-10, inclusive). As before, we will tackle this problem as a series of smaller steps:
- Set the background color to
"black"(with thet.bgcolorfunction) - Determine the number of grid squares
- Draw the grid of grey squares
- Draw white dots with a diameter of 15 at the interior intersections
The grid should itself be square and have a random number of squares in the range 5-10, inclusive, e.g., be 5×5 or 7×7. The squares should have a fixed side length of 100 and a pen width of 10. The drawing should be centered in the drawing window (i.e., if the grid was 10×10, the lower left corner would be at -500, -500).
This is another opportunity to reuse your polygon function, albeit in the context of a “nested” loop. As we saw in class, a pair of loops can be an effective approach for generating all combinations of values drawn from two sequences. In this case, we want to generate all combinations of coordinates for the lower left corner of the squares.
You can use a similar set of nested loops to draw the dots at the interior intersections, although you will likely need to change the loop sequences to only draw dots at the interior intersections. You can draw a dot with the t.dot function, which takes the diameter as an argument. Make sure to set the pen color to "white" so it shows up on the black and grey background.
At this point your function should be complete and exactly match the example above. As before, the positioning/size on your screen might appear slightly different. That is OK!
Specification
Name your file pa2_turtle.py. At a minimum your submission should have:
- A function named
polygonthat draws an empty polygon. The function must have 4 parameters, thexandycoordinates at which to draw the polygon, the number of sides, and the length of the each side. - A function named
curving_squaresthat has no parameters and draws the entire curving squares illusion from a blank canvas, exactly as described above. - A function named
pulsing_gridthat has no parameters and draws the entire grid illusion with a randomly sized grid from a blank canvas, exactly as described above.
Note: Gradescope requires that your program be named pa2_turtle.py. If you name it turtle.py, Python will not be able to find any of the functions in the turtle module (for reasons we will learn about later in the semester). Gradescope will test your functions by generating images using your code and the reference implementation and comparing them pixel by pixel. Thus your functions need to match the specification exactly.
Creativity Suggestions
Here are some possible creativity additions, although you are encouraged to include your own ideas. The amount of creativity points awarded will be based on creativeness and difficulty of implementation.
- [1 point] Create a new version of
curving_squaresthat includes a random number of equally spaced purple squares. Your squares should still overlap the circles. - [1 point] Create a new version of
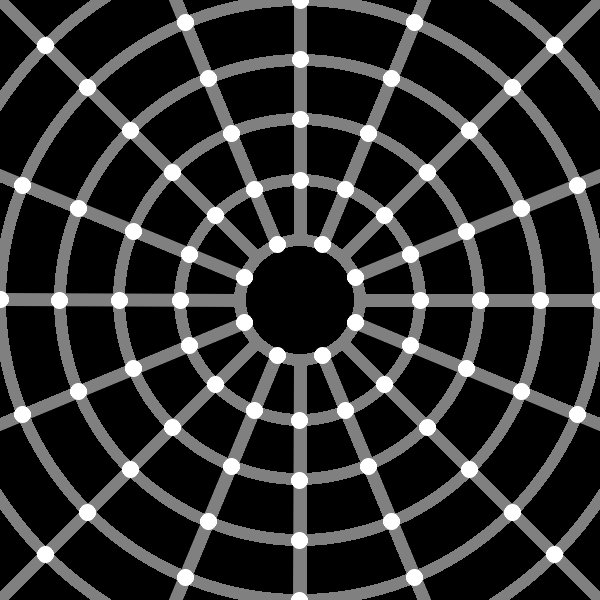
curving_squaresthat chooses a random color for the squares. This could be combined with the addition above (i.e., the same function could have a random number of squares, with random colors). - [1 point] Create a new version of the Hering illusion (with rays) from class, that overlays a cricle or a square instead of vertical lines.
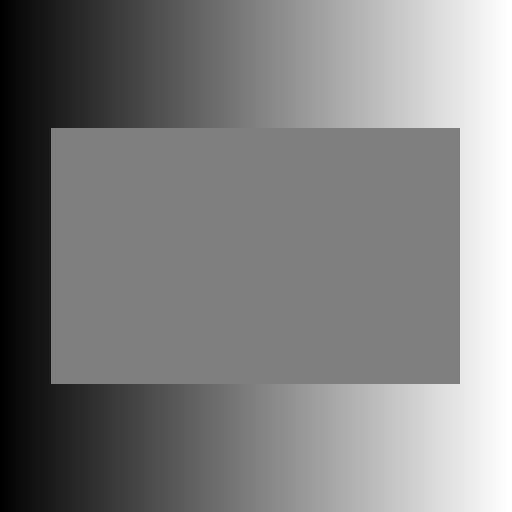
- [2 points] Create one of the other illusions shown below. The lines in the second example are actually straight and the recangle in the last example is a solid color! For the last, note that Turtle does not have built-in functions for drawing a gradient. Instead you will need to draw parallel lines of steadily changing color (a good place to use a loop!)
To receive the creativity points you MUST include in your comments at the top of the program a listing of your additions (otherwise, it can sometimes be hard to figure out). Make sure that your implementations of the required functions match the specifications. If you extend one of those functions, e.g., curving_squares as part of the creativity additions, create a new function, e.g., curving_squares_random, with your new functionality. That way Gradescope can meaningfully test the 3 required functions.
When you’re done
Your functions should be implemented in a single file named pa2_turtle.py. When you click the green arrow, i.e., run your program, nothing should happen. Your program should only define functions. All drawing operations should be contained within a function. Doing so ensures that Gradescope can meaningfully test your functions and provide useful feedback.
Make sure you do not use done inside your functions. Doing so causes the drawing functions to “hang” during testing and Gradescope to time out while testing your program without providing a feedback.
Make sure that your program is properly commented: * You should have comments at the very beginning of the file stating your name, course (including section number), and listing your creativity additions. * Each function should have an appropriate docstring (including arguments and return value if applicable). * Other inline comments where the code might be unclear.
In addition, make sure that you’ve used good coding style (e.g., including meaningful variable names, constants where relevant, vertical white space).
Submit your program via Gradescope. Your program file must be named pa2_turtle.py. You can submit multiple times, with only the most recent submission (before the due date(s)) graded. Note that the tests performed by Gradescope are limited. Passing all of the visible tests does not guarantee that your submission correctly satisfies all of the requirements of the assignment. Check out this guide({{ “/pa/gradescope.html” | prepend: site.baseurl }}) to submitting programming assignments to Gradescope.
Grading
| Assessment | Requirements |
|---|---|
| Revision needed | Some but not all tests are passing. |
| Meets Expectations | All tests pass, the required functions are implemented correctly and your implementation uses satisfactory style. |
| Exemplary | All requirements for Meets Expectations, 2 creativity points, and your implementation is clear, concise, readily understood, and maintainable (specifically shape sizes and spacing, e.g., circle radii, are set by or derived from relevant constants). |
FAQ
How do I speedup Turtle? Drawing is so slow!
The default drawing speed for Turtle can be quite slow (and thus large drawings take a long time to complete). To speed up the drawing invoke the turtle function t.speed with an argument of 0, i.e., t.speed(0), before your other drawing commands. The argument of 0 corresponds to the “fastest” speed setting.
How do I use other colors in Turtle?
There are several ways to specify colors in turtle. The documentation for the pencolor function shows the different approaches:
- You can use string names like
"red". This link shows the available colors by name. The names are not case sensitive in Python, i.e. there is no need to capitalize the names as shown in the link. - You can use hex strings with the RGB color, e.g.
"#ff0000"for red. This online color picker can can help you determine the hex string for a color. - You can specify the color as three numerical arguments with the RGB values. By default those numbers need to be floats in the range 0-1.
Gradescope is timing out when testing my program!
Make sure you are not invoking done inside your drawing functions. Doing so causes the tests to “hang” indefinitely and Gradescope to time out while testing your program. Unless otherwise suggested in the assignment, you shouldn’t need to use any of the “setup” or “teardown” functions like done or changing the screensize.
What does drawing optical illusions have to do with ‘[Computer] Science’?
The neuroscience underlying these optical illusions is pretty neat in itself! And the programming techniques we used (nested loops, deriving values from the loop variables) are very common in all kinds of computing. For example, we might want to simulate the behavior of a fluid in a grid. We would use a similar set of loops to do so (albeit with 3 nested loops!).
Adapted from a Nifty Assignment by Faan Tone Liu (Liu 2023).