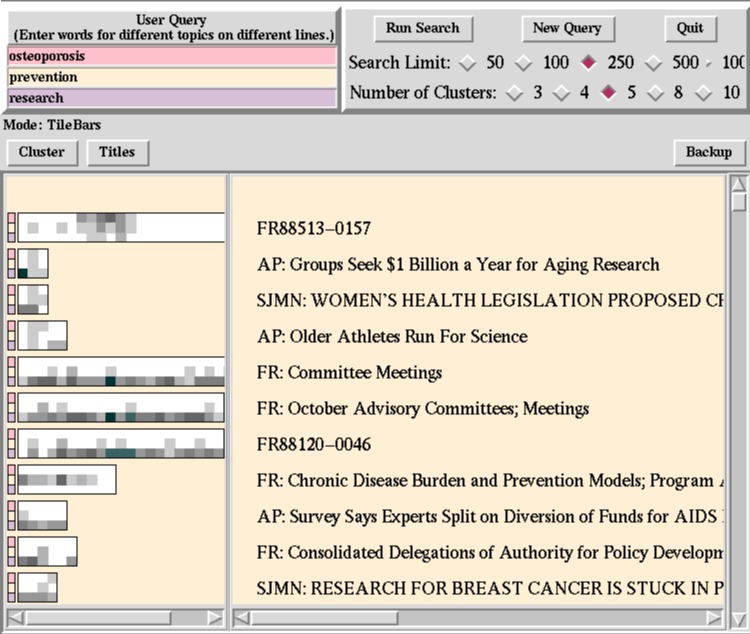
A tileBar is a data visualization interface used in conjunction with a search feature, query terms, and expository text. The tileBar interface forces the user to input one or more queries, generally of different topics and then displays each document's relevancy to the search through the use of rectangles, which show the document's length through the size of the rectangle, the number of sections through the number of squares, and each section's frequency of each query through their color, where a white square denotes a frequency of zero and a black, or the darkest color possible if not using black, square to denote a frequency of eight or more. Usually the search results are ranked by two metrics: number of overlapping squares in each section and secondly by the overall frequency of terms in a given document. When a given square is clicked by the user within a tilebar, the document opens at that particular section with the query terms highlighted.
TileBar Example