CS 467 - Lecture 07
Arcs
We have an arc() function
arc(x,y,w,h,start,end,[mode], [detail])
x,y: position of the arcw,h: size of the arc (works like circle)start: angle to start the arcend: angle to end onmode: how to finish the arc- unspecified:
PIE, but without lines (DEFAULT) CHORD:draw a straight line to close the shapePIE: connect lines back to the centerOPEN: don't connect the ends (fill will followCHORD)
- unspecified:
detail: only used by WebGL mode to specify the number of points to draw around the arc
example: making a pie chart
function setup() {
  createCanvas(600, 600);
  angleMode(DEGREES);
  colorMode(HSB, 360, 100, 100);
  noLoop();
}

function draw() {
  background("#fafafa");

  pieChart([5, 2, 4, 10, 7], 200, 200, 200);
}

function pieChart(data, x, y, size) {
  const total = data.reduce((a, b) => a + b, 0);
  const colorOffset = 360 / data.length;

  let current = 0;
  data.forEach((d, i) => {
    const angle = (d / total) * 360;
    fill(colorOffset * i, 100, 100);

    arc(x, y, size, size, current, current + angle, PIE);
    current += angle;
  });
}
Curves
p5.js provides a couple of different ways to create curves
in general, however, it provides two main approaches: Bezier Curves and Catmull-Rom splines
these follow the two primary approaches to curve generation: interpolation and approximation
- interpolation tries to find a smooth path through all of the points
- approximation doesn't go through all of the points
in both cases, there is a stand alone function for generating a simple curve, or we can use it within beginShape() and endShape()
Bezier curves
The Bezier curve is a hybrid
- interpolates the end control points and approximates the others
With three points, we can think of this as three simultaneous interpolations
At time t,
This makes the quadratic
We draw the curve by iterating through values of
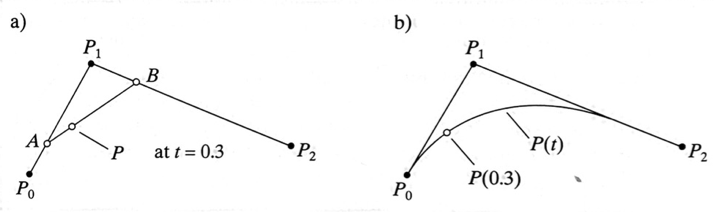
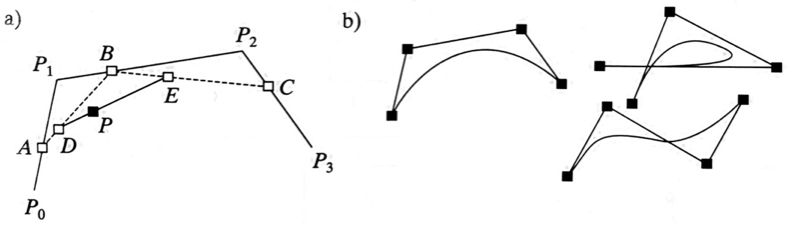
With four points, we extend this out even further to get a cubic polynomial, but follows the same form
images from "Computer Graphics using OpenGL" by F.S. Hill, Jr.
bezier()
The bezier() function uses the four point form
It takes eight arguments, which are the x and y coordinates of the
- first anchor point
- first control point
- second control point
- second anchor point
bezierVertex()
This version is used between beginShape() and endShape()
note that it doesn't make sense to call beginShape with arguments for the curve
Since it is meant to be used piecewise, the arguments only include
- first control point
- second control point
- second anchor point
The first anchor point for the first segment needs to be set with vertex
After the first segment, the last anchor point is used as the first anchor point for the next segment
Bezier curves give us nice curves, with fair control used in
- tools like Illustrator
- TrueType fonts
- SVG
They also lie within the convex hull of their control points
Downsides
- the control points have global influence and moving one shifts the whole curve
Piecewise construction
to deal with the lack of local control, we can construct out beziers piecewise (which is what we do in p5.js)
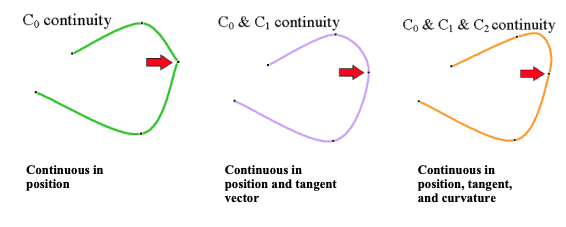
There are three levels of continuity we worry about when piecing together curves
The connection point is called the knot
- continuity
- the segments meet with no gaps
- this is easy to guarantee
- continuity
- the first derivative is also continuous
- there are no corners and the normals/tangents of the line are continuous
- continuity
- the second derivative is also continuous
- the tangents and normals are continuous
is easy -- just make the lines connect we can get if we make sure that the two control points on either side of the anchor point and the anchor point itself are all on the same line
is more difficult
Curve
p5.js can also make Catmull-Rom splines aside, Ed Catmull is one of the co-founders of Pixar
Catmull-Rom splines are interpolated curves -- the curve goes through all of the control points (other than the first and last)
It is continuous
it does not, however fit within the convex hull of its control points
they can also form weird loops if the points are tight together
curve()
like the bezier curve, this takes eight arguments
- first control point
- first point
- second point
- second control point
curveVertex()
This is a little easier to use than the bezierVertex
we just have an x and y
There needs to be a minimum of four points with four points it will draw the curve between points 2 and 3, using 1 and 4 as control
adding more points continues the curve, with the last point always acting as a control point
Last updated 03/08/2023