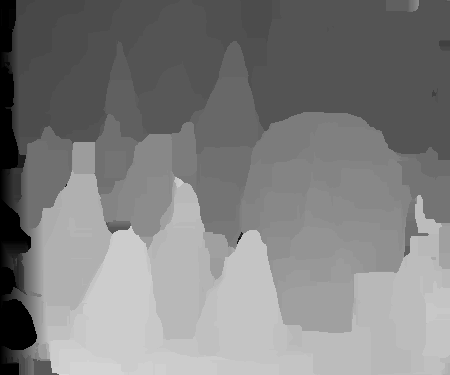
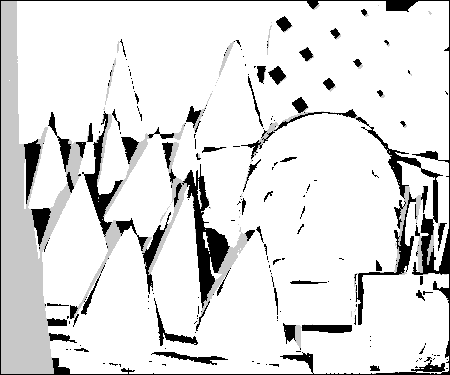
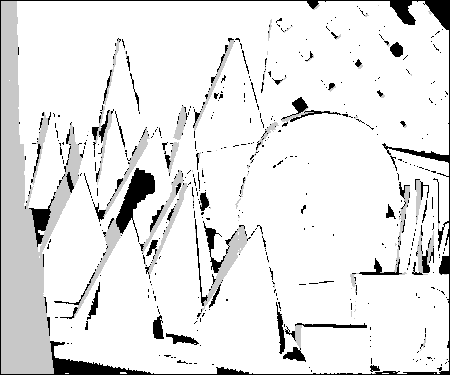
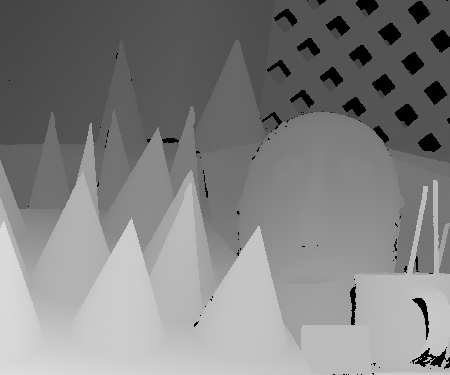
Both disparity maps and error maps are shown. Errors are evaluated for error threshold t=1 in non-occluded areas (shown in black; grey areas correspond to errors in occluded regions).
SSD:


Dynamic programming:

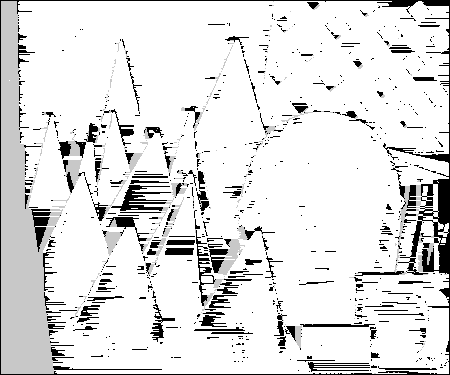
Graph cut:
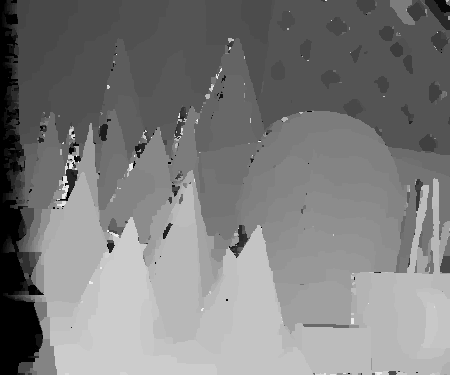
Ground truth:
SSD:


Dynamic programming:


Graph cut:


Ground truth:

Bad %           Cones               Teddy
           t = 1    t = 2      t = 1    t = 2
      SSD  10.6%     7.3%      16.5%    12.0%
      DP   10.5%     6.5%      14.0%     7.1%
      GC    7.7%     4.5%      16.5%     9.7%