Complete as much of this prelab as possible before lab on Thursday / Friday. Ideally complete the entire prelab, but if you can get through Steps 4, 5, or 6 in the Koch curve problem that would be a good start.
From within the Thonny application, create a single Python file username_hw3.py with all your work for this assignment in it. Include a comment at the top with your name, the date and homework number, and your lab section.
This week we will learn one approach for doing some simple drawing
in Python. We will use the turtle library. You can find
more information in the turtle
documentation. A quick reference is included at the bottom of this
lab. Give it a perusal before you move on.
Here is a simple function that draws a square. Note that
length is a parameter to the function so the function can
draw squares of all sizes.
def drawSquare(length):
    """
    Draw a square with sides of size length.
    """
    turtle.forward(length)
    turtle.right(90)
    turtle.forward(length)
    turtle.right(90)
    turtle.forward(length)
    turtle.right(90)
    turtle.forward(length)
    turtle.right(90)
To see this function in action, use this "helper" function:
def drawSquareScene():
    """
    Helper function to call drawSquare() function.
    """
    drawSquare(100)
    turtle.done()
Paste both of these functions into a script. Begin your script with
import turtle. Run the script and then call
drawSquareScene() in the interpreter.
Once you have seen the turtle draw the square, close the turtle window.
Notice we used a function to abstract the turtle’s
behavior. When you call drawSquare(), it draws a square
and we no longer worry about the process. Also notice that we
didn’t put anything into drawSquare() that
wasn’t directly related to drawing the square. This means we can
draw any size square, anywhere on the screen and in any color,
provided we change those things before calling
drawSquare().
Write a recursive function drawKoch(length,
generations) that draws a fractal shape called the Koch
Curve. The Koch curve is a fractal – a shape that is
self-similar, that is, it can be decomposed into smaller
versions of the same shape.
Many of the techniques that we use to generate fractals computationally rely on the repetition of a set of steps, so we tend to talk about generations, which are the number of iterations that we used to produce the drawing. The Koch curve is a fairly simple one, and we can see its structure most clearly, by looking at how it changes from one generation to the next.
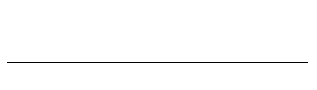
The starting place (generation 0) is a straight line.
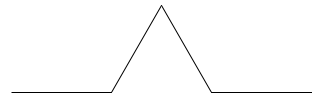
For the first generation, we cut the line into thirds and replace the middle segment with two segments of the same length, forming two sides of an equilateral triangle.
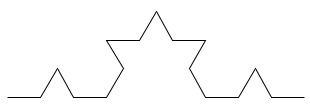
The second generation is formed by applying this same process to every line in generation 1.
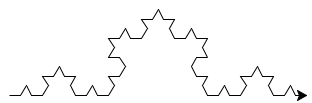
Further generations are formed by repeating this process, taking each line, breaking it into thirds and replacing the middle segment with a bump. Conceptually, if you take this out to infinity, you will have a very curious mathematical phenomenon – an infinitely long line between two fixed points a finite distance away that also occupies a finite area. In practical terms, however, when the length of the line becomes 1 pixel long, that is pretty much as small as we can get.
To actually draw the shape, our process will really be the opposite of what is described above. We don’t want to draw a line and then go back and remove a piece. Instead, we will start with the highest generation of the fractal first. If you think about a generation 2 curve, it is really made up of four generation 1 curves that are each 1/3 the length of the generation 2 curve. But each of those generation 1 curves are made up of generation 0 curves 1/3 of that length. What that means is that we don’t actually draw any of the higher generation curves, the only thing we draw is a whole bunch of generation 0 curves (straight lines!) in different locations.
drawKoch() function.
def drawKochScene():
    """ Setup the canvas for drawing the curve and draw it."""

    # pick up the pen and move the turtle so it starts at the left edge of the canvas
    turtle.penup()
    turtle.goto(-turtle.window_width()/2 + 20,0)
    turtle.pendown()

    # draw the curve by calling your function
    drawKoch(30, 0)

    # finished
    turtle.done()
Step 2: Start writing the drawKoch()
function. Define the function and make sure it takes parameters
length and generations (it is OK
to abbreviate if you wish, eg, to
shorter variable names such as
L and gen). We will be
drawing this shape using a recursive function. The
generations parameter of the function will control
the recursion. The base case is when generations is
0. In that case, the turtle should just draw a straight line of
length length (it doesn’t matter which way the
turtle is facing, we just go forward).
Step 3: Write the base case. When generations is
0, draw a straight line of length length.
Step 4: Test this by calling drawKochScene() from the interpreter. It should draw a line that is 30 pixels long.
Step 5: We are going to start work on the recursive case, but
it won’t be recursive yet. When generations is
greater than 0, draw a first generation curve. We want the curve
to fit within length pixels. So, move forward
length/3 pixels. Turn left by 60 degrees. Move
forward length/3 pixels (putting you at the apex of
the triangle). Turn right and draw the second leg of the
triangle. Turn left again and draw the final base line. You should
now have a generation 1 curve that fits on a length
length line
Step 6: Test, and make sure that when you change the number of
generations in drawKochScene() that you get a
generation one curve.
Step 7: Time to go recursive. Instead of drawing straight lines
in the recursive case, each call to forward should be replaced
with a call that draws a Koch curve of the same length (i.e., one
third length), and one generation less.
Step 8: Test this by entering some different generations into
the call in drawKochScene(). We recommend starting
small with something like a length of 200 and 1 generation just to
make sure your code is working. Then you can work up to bigger
curves and higher generations. IMPORTANT Keep the
number of generations low or you will be waiting for it to finish
forever. If you want to try higher generations, you should turn
off the tracer (the tracer is what animates the drawing
process. With it off, you just get the final picture). You can do
that by putting the line turtle.tracer(False) before
it draws and the line turtle.update() when you have
something you want to display (i.e., before
turtle.done()). A second problem you may encounter is
if the length gets to be less than 1 before you hit the base case,
the line segments drawn by the base case will all have a length of
0, and the curve will not draw at all.
For the prelab portion, you should have 4 functions (turn in with
the rest of HW3): drawSquare(),
drawSquareScene(), drawKoch(),
drawKochScene(). Each function should have a docstring,
and the top of the file should include a comment listing (at a
minimum) your name, the date and homework number, and your lab section.
You will continue working on this same Python file and add more
function definitions when you continue working on the rest of Homework 3.
Python includes a
library called turtle, which allows us to draw some
simple graphics with a turtle that can draw wherever it walks. So, we
issue commands to tell the turtle where to go, and a drawing appears
as it moves. Here are the most important commands. More can be found
in the online
documentation.
forward(distance)distance in the direction it is facing.backward(distance)distance in the opposite direction to where it is facing.right(angle)angle. Note that this can be any angle, not the four cardinal directions we had with LightBot.left(angle)angle.goto(x, y)pendown()penup()pencolor(colorstring)fillcolor(colorstring)begin_fill()end_fill()tracer(state)True or False to turn the tracing on or off.update()window_width()window_height()