A way of visualizing multivariate data that reduces the data into two dimensions and shows the relationships between them
by Kent Ratliff and Emily Sarich
The PivotGraph is a visualization technique developed by IBM developers in 2006. It takes data, usually representing some sort of connectivity between groups, and aggregates it to show trends and relationships between the groups. This aggregration reduces the number of variables to look at, giving the user a better understanding of general trends.
The PivotGraph starts with a selection of dimensions in a set of multivariate, connected data. It then uses a rollup algorithm to aggregate the data into discrete categories, as shown below:
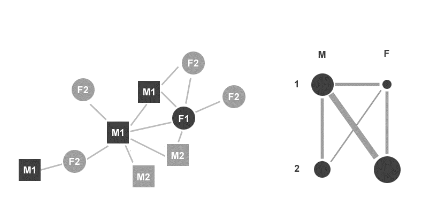
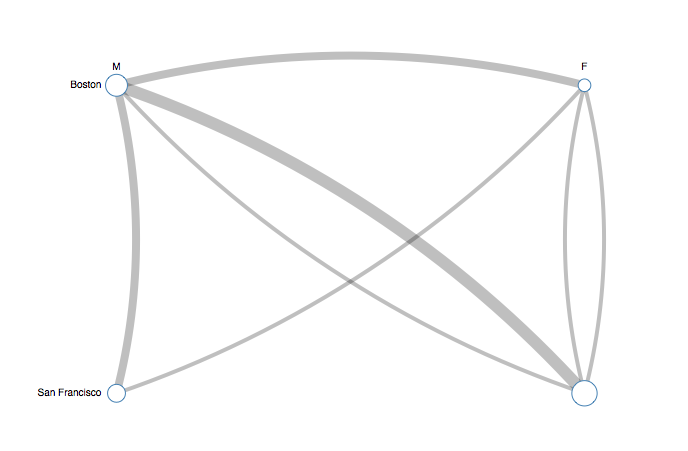
Once the data has been aggregated, it assigns each dimension a row or column and places a vertex in the correct row/column for each attribute.
It then draws in the connections between each vertex, with the width of the edge representing the number or strength of the connection between the vertices.
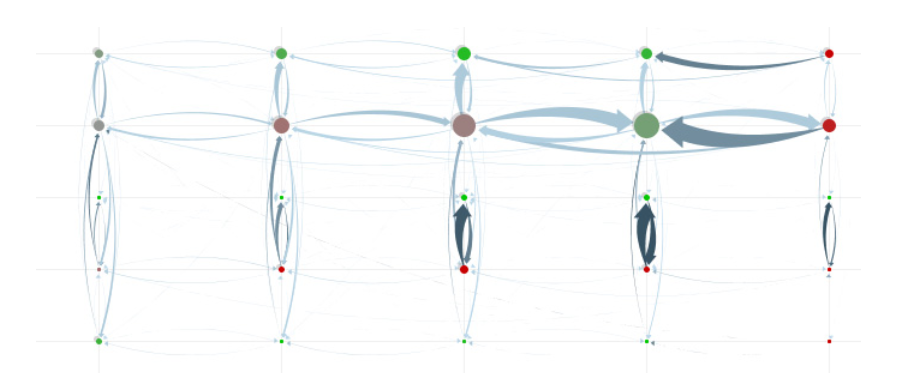
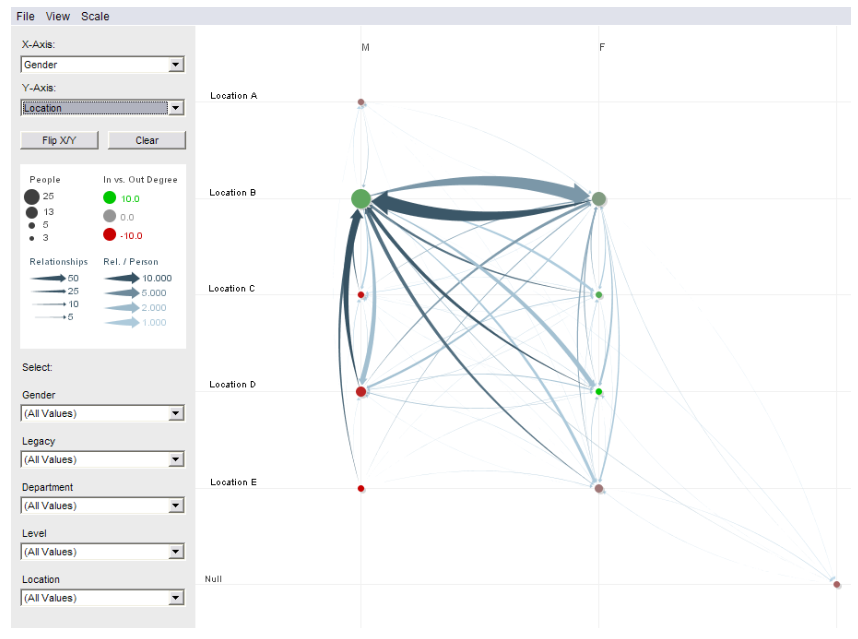
This implementation of the PivotGraph also colors the vertices based on the number of incoming connections versus the number of outgoing connections, and the edges based on the number of connections. It also allows users to select which dimensions to roll up by, and filter down the data, giving a great deal of interactivity that makes it even easier to explore the data:
Advantages:
Disadvantages: