Due: 2014-01-22 10:30a
Important: Because this requires a resource (i.e., a textfile), submit your whole sketch directory and not just the .pde file. You can zip it if you like, or just drag the whole directory into the DROPBOX, either will work.
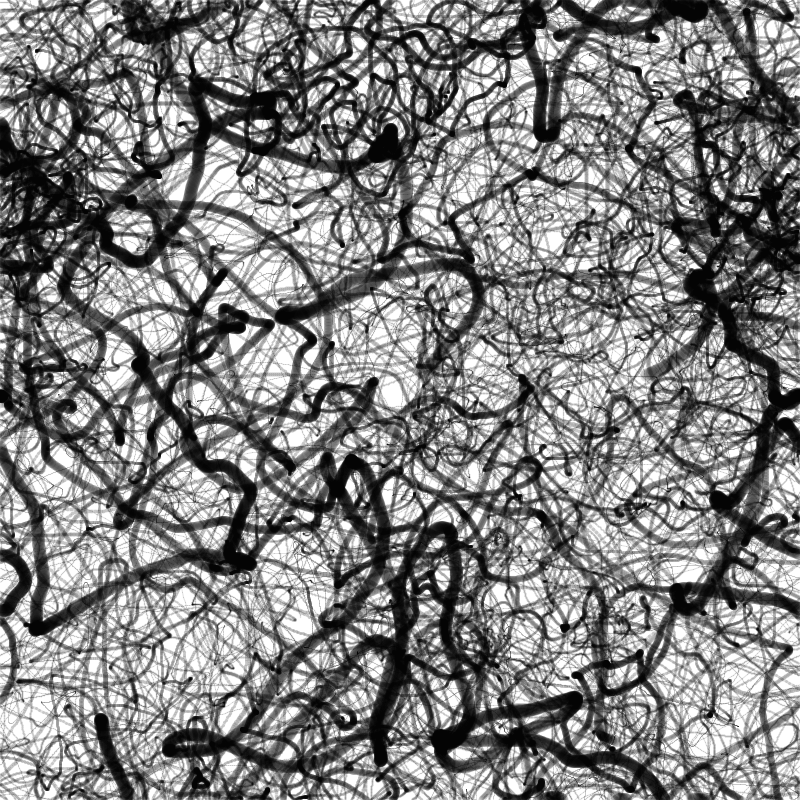
Table and TableRowYou are going to start thinking I have a worm fetish of some kind, but yes, we are going to write yet another exercise that involves making long squiggles across the canvas. This time you are going to transform census data into tracks on the canvas. Here is an example:
This is really a variant of what I did with the census data in class. We are just taking a couple of metrics from the census data and mapping them to visual representations.
The implementation for this will be similar to the drunken ant we did a couple of assignments back. Start by writing a class. I called mine Snake, but you can call yours whatever makes sense to you. The class should have at least seven properties (you can certainly add more of your own).
x and y [floats, current position of the agent]lastX and lastY [floats, previous position of the agent]weight [float, the stroke weight for your drawing]noiseX and noiseY [floats, variables to keep track of where we are in noise space]range [float, the maximum range on the possible next positions]In the constructor, initialize x and y to some random position on the canvas. Initialize lastX and lastY to be equal to x and y respectively. Finally, initialize noiseX and noiseY to some random number between 0 and 100.
The main work is done in the update() function. Here, you will picking the next destination for the agent, drawing a line form the old position to the new position, updating the old positions to the new positions, and then doing a wrap around to handle the agent wandering off of the canvas. In other words, more of what you have done before.
Step one: set the stroke and stroke weight.
Step two: Calculate the new x and y positions. Use the last value and add a random amount generated using the noise() function, passing in the appropriate noiseX or noiseY (we will stick to 1D noise). The range of the noise will be range, and add (subtract) an offset so the result is centered at 0 (e.g., if the range is 6, the result should be somewhere between -3 and 3). After calculating x and y, add some small amount (like 0.008) to both noiseX and noiseY.
Step three: Draw a line from (x,y) to (lastX, lastY).
Step four: Update lastX and lastY. If they have walked off the edge of the canvas, wrap them around to the other side.
So far, this just seems like the drunken ant (if perhaps slightly less random because we are using noise()). We want to connect this up to our data.
Create an array of your objects and initialize it in setup() to have one object per row in the table. Iterate over the rows in the table like we did in the examples. Start by setting the weight based on the population, and the range based on the income. This will get you the picture (or something similar) that I put above.
Your draw() function will just iterate over your agents and call their update() functions.
Again, there is a lot you could do here. There are a number of other fields in the data that you could make use of, and I didn’t get into color at all. At a minimum, I want to see at least one more field form the data incorporated into your drawing. Beyond that, go crazy. Since we aren’t shooting for great insights, there is no wrong answer. If you want to think about this more and really make meaningful metaphors to connect data to behavior/visual representation, that’s great. If you just want to make a pretty picture, that’s cool as well. I just want to see you try some things out.
Also, don’t feel like you need to use all of the data, or even to use the data as is. You could, for example, add columns to the data like region (northeast, south, southwest, northwest, midwest, etc…), or political leaning (red or blue). It all comes down to the story you are telling.
Documentation from some of you has been a little sparse – make sure you tell me what you did that was was going beyond the bare bones. If there is some meaningful connections you are making, tell me about them.
I would like you to name the sketch using this pattern: username_hw10.
Submit at least one image and name it using the pattern username_hw10-####.png.
Don’t forget the documentation block below at the top of your sketch. Make sure that you specify what you did that was cool and interesting.
/**
Assignment Ten

A description of the sketch.

Your name
The date
**/
I would like this code turned in in the DROPBOX on MiddFiles. You can refer to the reference on the LIS wiki to help you connect to the file server.