Due: 2016-03-14 01:45p
I would like you to build a graph of the top green supercomputers using data from the Green 500 list. The Green 500 list is a ranking of the most energy efficient supercomputers in the world. Unlike the Top 500 Supercomputers list, the computers that are highly ranked in the Green 500 are not just fast, they are also energy efficient. I have a local copy of the data at http://www.cs.middlebury.edu/~candrews/classes/infovis/data/green500_top_201511.csv of the current list.
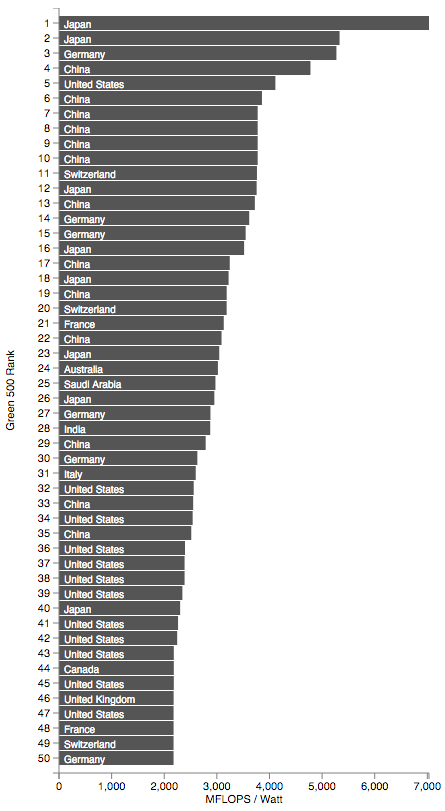
I would like to see a bar chart showing the MFlops/Watt.
There are some twists (of course).
I would like you to restrict yourself to the top 50 computers. You will have to dig a little into JavaScript to figure out how to trim the data.
I want you to make the bar chart horizontal.
Within each bar, write the country where the computer was developed. You will need to append a text item and place it appropriately.
Here is an example of what this might look like, but you are welcome to style yours however you like.
Please put this code in a file called hw4_bar.html
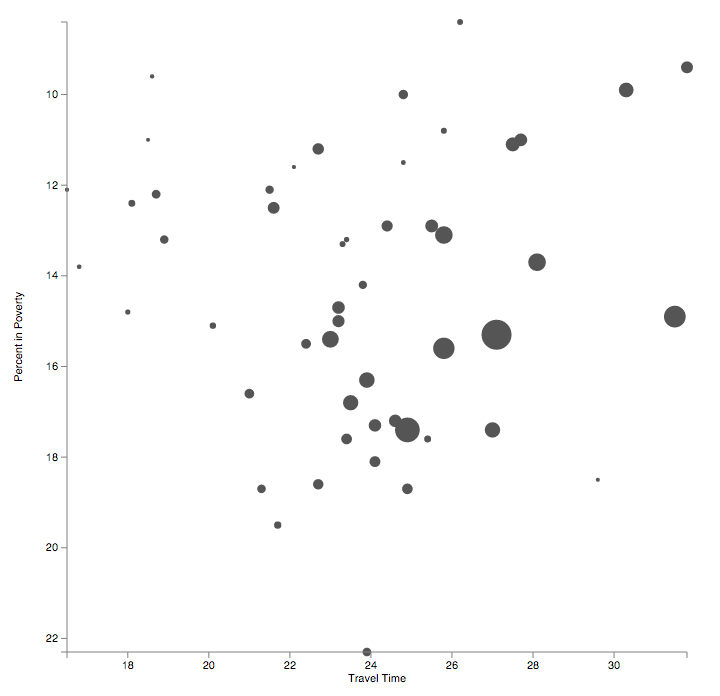
A bubble chart is essentially a scatterplot where an additional attribute is encoded as the size of the dots. I would like you to create the chart from data in our census data. You can pick any combination of dimensions form the data that you like.
You can basically use everything you learned about bar charts to build the scatter plot. The main difference is that you will use circle instead of rect. The important attributes of circles in SVG are cx, cy, and r (the x,y coordinates of the center of the circle and the circle radius).
The bubbles should range in size from 2 to 15. When you size them, remember the radius vs area problem. The problem is that we don’t set the area of the circle, we set the radius. The solution is to make use of a different one of the D3 scales. Instead of using the linear scale, we will use the sqrt scale. We only need the area to be proportional to the represented value, so the PI part can just be removed as a constant multiplier.
Here is an an example. Again, styling (and dimension choice) is up to you. You will note that my axes don’t start at 0. Sometimes this is appropriate depending on the data and what you are looking for. Take a look at d3.extent.
Please put this code in a file called hw4_bubble.html
For this assignment you will work individually to give you an opportunity to get to grips with D3 (and for those of you new to it, JavaScript).
Please submit the two files on Moodle.