Due: 2014-05-16 11:55p (altered so we can take some more class time to work on this on Monday)
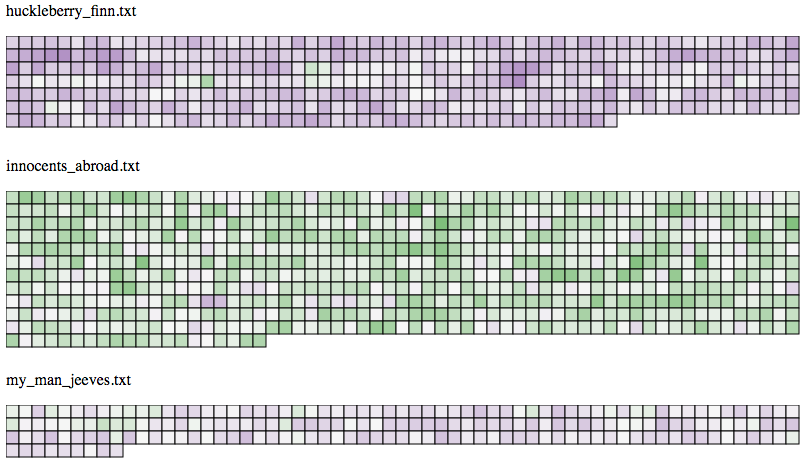
You are going to create some text fingerprints like we saw in lecture. In broad strokes, you are going to read in some text files, segment them and figure out some metric for all of the words in each segment. You will then draw a grid where each box in the grid is colored based on the value you calculated. To make your lives easier, the metric I would like you to use is “average word length”. When you are done, you should get something like this:
To help you out, I am again providing you with a stub file. The stub file sets up the basic structure of the page. At the top, there is a control that allows a user to upload text files. Yes, rather than hard coding a set of files in, we can actually load the text files from the user’s own files (HTML5 has some cool features).
The code that I’ve given you handles all of the file loading. Your primary work will be filling in two functions that my code calls.
The first function you should work on is bundleTextData(). As my code uploads the content of each file into the browser, it passes the result to this function for processing. You will be given the name of the file and the entire contents in a string. You will need to split the string up into an array of words, cleaning each word as you go. You will then break the array up into segments based on the WORDS_PER_BLOCK constant from the top of the file. The result of this should be an array of values; one value for each segment. Bundle this and the name of the file together into an object and return it.
Make sure to make use of the Chrome debugger to make sure you are getting reasonable values before trying to draw them.
Once you have good values, move to the drawTextVis() function. I’ve given you some guidance in the comments, but if you prefer to accomplish the task in some other way, by all means, go right ahead. We should be able to see the name of the file, and under that a grid representing the file, with the cells colored by the result of the metric. Mine are colored using a three value diverging scale. We get that in D3 by passing three colors to the range, and three values to the domain. I use the median for the center value in the domain, but the mid point between the high and low could be valid as well.
All computer scientists and programmers should eventually learn the basics of working with regular expressions. JavaScript’s support is pretty similar to other languages you may have used. Note, however, that we do not put them in quotes. To convert the string to an array of words, use /\s+/ as the argument to the split() function. This says to match one or more whitespace characters (which includes tabs and new lines).
To remove leading and trailing punctuation characters, I recommend using the string replace() function. We can again use regular expressions for this task. The regex /(^(\W|\d)+|\W+$)/g says to match one or more non-word characters or digits at the start of the string or one or more non-word characters at the end of the string. The g says to do this globally. For the second argument to replace(), simply pass the empty string.
The best place to get some sample texts is from Project Gutenberg. You want the plain text versions. If you are getting texts from Project Gutenberg, there are a couple of cleaning steps you probably should do for better fingerprints.
Erase all of the Project Gutenberg boilerplate from the start and end of the file.
Remove any table of contents of lists of figures
Do a global find and replace and replace ‘--’ with ‘ -- ‘ (or the empty string if you prefer, since the hyphen will be removed by your processing later). For some reason, most PG texts leave the spaces out so you get very long words, and since it is between words with no spaces the regex based procedure I described doesn’t remove them.
Do another global find and replace and just remove all of the underscores. PG uses these for italic or underlined text, and my regex doesn’t remove them (you could also update the regex).
The visualization should be contained in a single HTML file called username1+username2_hw10.html. Turn the file in on Moodle in the usual way.